Tuesday, February 28, 2006

January Market Wrap

MAR released their January sales report today. Here are the latest SFH numbers plotted to show their relationship to recent trends over the past few years.


Here are the latest price and inventory data for Condos.


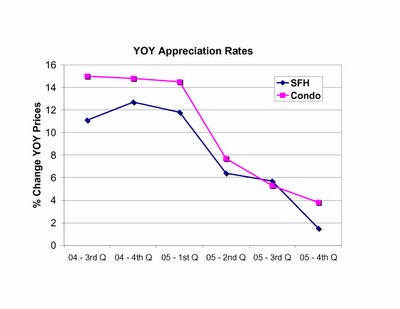
So far it hasn't made the headlines that I've seen, but prices are DOWN (albeit slightly) year over year for SFHs. This breaks a string of 115 consecutive months of positive appreciation.

And inventory numbers continue to accelerate to the upside - looks like I'll need to expand the y-axis for these plots by summer.

Money quote from MAR press release:

"...sales of detached single-family homes fell to their lowest January level in 10 years..."

Spin from the MAR Talking Points:

"False assertions of a price bubble in the local market also have prompted some buyers to delay their home buying decision in anticipation of sharply lower prices come this spring."

"Inventory, as stated in months of supply also rose steadily from 8.2 months last January to 14.3 months of supply in January 2006... In Massachusetts, the market is at equilibrium for buyers and sellers when 7.5-8.5 months of housing supply exists, thus despite concerns about an inventory glut, there’s a healthy balance between supply and demand at the present time."

As noticed by a reader, the statement above has been edited by MAR. The new text is shown below, and now reflects a more "reality-based" assessment of the market:
"In Massachusetts, the market is at equilibrium for buyers and sellers when 7.5-8.5 months of housing supply exists, thus a strong buyers market emerged has emerged over the past month due to surging supply levels and more moderate demand."

"The number of condos for sale has increased 47.8 percent in the past year... Inventory, as stated in months of supply, also has risen in the past year, climbing to 13.7 months of supply
this past January from 9.5 months of supply in January 2005."

To see where these "balanced" inventory numbers will likely be sending prices, check out my recent post.

But in case anyone might be worried about the market, MAR is here to reassure you:

"Predictions of steep price declines in home values made this past fall remain largely unfounded."

How about long, slow grinding declines in home values for years to come? All the pieces are in place: exploding inventory, record low affordability, net out-migration, stagnant job growth and wages, uptrending foreclosures, payment shock from resetting mortgages. The only questions now seem to be: How fast, and how far down?

Tuesday, February 21, 2006

Homeowners or Homedebtors?

The real estate industrial complex and our elected leaders continue to extoll the virtues of homeownership. Certainly it's a laudable goal to own one's home. But while headlines trumpet homeownership rates (the percentage of households that pay a mortgage or own outright, rather than rent), they do not typically address how much of our home's we actually own. The following chart (from Barron's Econoday courtesy of The Big Picture: Real Estate , 4/17/2005) shows that Owners Equity (as a percent of home value) has declined markedly over the past 25 years.


Notice that even over the last few years during a time of strongly increasing home prices, owner equity has continued to decline. How? The housing ATM has induced the continued growth of mortgage debt (the red bars) at a faster rate than real estate values have grown (blue bars).

This borrowing has been a major contributor to GDP over the past few years. Calculated Risk has used the Goldman Sachs estimate that ~2/3 of mortgage equity extracted ends up fueling consumption to calculate US GDP over the past 10 years with and without the housing ATM.


While the continued binge of borrowing has fueled consumption and GDP growth, it has created unprecendented indebtedness in US consumers. The Federal Reserve tracks several metrics of debt. Among these is the Debt Service Ratio (DSR), which is an estimate of the ratio of debt payments to disposable personal income. Debt payments consist of the estimated required payments on outstanding mortgage and consumer debt. The financial obligations ratio (denoted Total in the plot below) adds automobile lease payments, rental payments on tenant-occupied property, homeowners' insurance, and property tax payments to the debt service ratio. Both data series plotted quarterly over the past 25 years tell the story of escalating consumer debt.

What does all this have to do with the housing market? Present conditions, marked by highly leveraged homeowners with a shrinking share of equity fueling a debt-dependent economy, represent a fundamentally unstable environment, and a potential recipe for downward spiraling house values.

Wednesday, February 15, 2006

Spin City

MAR has 4th Quarter and 2005 market numbers out today. The Boston Globe has commentary from David Wluka, MAR president:

"The accelerated sales pace of recent years has all but ended, and we're returning to a more normal market," said the association's president, David Wluka. "Our strong seller's market has been replaced with a more balanced one that will help stabilize home prices."

Wluka is predicting continued moderation in prices. He said demand should remain high because of low mortgage rates and a bigger supply of unsold homes.

Pardon my ignorance, but exactly how will the increasing supply of unsold homes spur demand? This is realtor reasoning at its most wishful and non-sensical.

"Prices may soften, but look for flat to modest appreciation this year rather than sharp price declines," Wluka said.

At least he didn't invoke the "soft-landing" phrase. Now that we've heard the spin, how about a dose of reality. Here's a look at YOY appreciation rates for the last 6 quarters, as reported by MAR:


Headed for a soft-landing? Looks more likely that the MA market is headed for a crash-landing.

Monday, February 13, 2006

Boston poised for downturn?

Boston is becoming a favorite exmaple for those expecting a downturn in real estate prices. Case in point, this piece from Fortune: A Tale of Two Markets (free link here).

...talk to almost any broker in Boston, by contrast, and he'll tell you that business has slowed in the past several months. Consider John Ford. Just two years ago, five properties was the most he needed to show a prospective buyer before eliciting an offer. "And then it would be a bidding war," says Ford, who employs 30 agents in three Boston area offices. Today he's averaging 14 property tours before a skittish client is ready to buy.

In the city's suburbs, single-family homes have gushed onto the market. Inventory increased to 4,281 by January, 79 percent higher than a year earlier, according to MLS Property Information Network.

LINK, a company that tracks the downtown market, shows an inventory increase of 61 percent in the last year. And 2005 foreclosure filings were up 45 percent in Suffolk County, which includes Boston. Massachusetts was one of just three states in the union to lose population last year -- never healthy for real estate, which depends on population growth. Prices are still holding up, but there are no Gary Wattses in Boston guaranteeing another year of gains.


On the subject of predictions for the coming year, Fiserv Lending Solutions recently came out with price forecasts for 379 markets. No methodology provided, so your guess is as good as mine how they came up with their predictions. The local markets (excluding Western MA):

2006 Predicted Price Changes
Boston-Quincy, MA -1.3%
Cambridge-Newton-Framingham, MA -0.1%
Essex County, MA -0.9%
Barnstable Town, MA -2.4%
Worcester, MA -0.5%
Providence-New Bedford-Fall River, RI-MA -2.1%


Couple these predictions with expected inflation of 2.9% and we could easily be looking at real declines of 5% across many parts of the region. A crash? Not according to this forecast. But the emerging consensus for price declines is likely to have profound and long lasting effects on market psychology. Snowballs rolling downhill start small...

Tuesday, February 07, 2006

RE cheerleaders changing their tune

First up, the always quotable David Lereah, chief economist at the NAR:

August 12, 2005:
SmartMoney: Do you think the real-estate market will still be able to provide a sound investment?
David Lereah: Real estate is still a great investment opportunity for households. Price appreciation will continue. It may not be at 20%. It may be at 10% to 15%, or may even go down to 5%... You don't need a 20% price appreciation to do well. You could still have price appreciation of 10% and beat most stocks. I think for the remaining years of this decade real estate will still be a good investment... The fundamentals are there. The demography trends and population trends are there. It's a once-in-a-generation opportunity.

Feb. 7, 2006:
"Sometimes people lose sight of the fact that real estate is cyclical," he said. Lereah said the national median existing-home price for all housing types is expected to rise 5 percent to $219,200 -- a rate of increase far below the double-digit annual gains notched during a five-year market rally.


This is the same David Lereah who wrote:
Are You Missing the Real Estate Boom? : The Boom Will Not Bust and Why Property Values Will Continue to Climb Through the End of the Decade - And How to Profit From Them. Published February 22, 2005

His previous book coincided with a major market peak:
The Rules for Growing Rich : Making Money in the New Information Economy
Published June 27, 2000


And what about Robert Toll, CEO of Toll Brothers, who sold more than $120 million worth of stock and was paid more than $31 million in 2005 while spouting the following:

October 2, 2005:
Insana: But are the solid housing fundamentals that everyone's talked about for the last couple of years supportive to housing through 2006?
Toll: And '07, '08, '09 and '10. Absolutely.

February 7, 2006:
Toll also said slowing demand and delays obtaining inspections, certificates of occupancy and utility hookups forced it to cut its outlook to sales of 9,200 to 9,900 homes during the fiscal year ending Oct. 31 from a previously lowered view of 9,500 to 10,200. (Toll Brothers rattled the market in November when it first cut its forecast range from 10,200 to 10,600).

New orders during the quarter fell to 1,572 from 2,209, while the value of the contracts declined 21 percent to $1.16 billion.

Monday, February 06, 2006

Spring Market Kickoff

The Superbowl is over, which means the unofficial kickoff for the spring real estate market is here. Let's face it, the winter is a slow time for real estate and it's tough to discern much about market strength. That hasn't slowed down postings to the epic message board over at the Boston Globe site (Where are real estate prices heading?) - 910 posts and counting.

To celebrate the season I took in an open house yesterday. Showed up 90 minutes into a two hour open house, and was the third to sign in - it did pick up while I was there, at least a couple other people came through. It was a small cape, on a reasonable lot (0.35 acre lot), and in a nice western 'burb of Boston. Not much to distinguish the house - no recent updates (56 yr old), one bath, two small bedrooms. The price? $469K, marked down (in hand on the listing sheet) from $499K. Experiences like this reinforce my sense that the suburban market in particular seems out of whack.

Needless to say, the next few months will be interesting. Hopes and fears abound, the market will reveal its answers in due course.

One intriguing early return on 2006, courtesy of Boston Real Estate Watch:

The following information was obtained form MLS:

Boston condo market statistics

January 2005
Average List Price: $445,767.00
Average Sales Price: $430,408.00

January 2006
Average List Price: $417,936.00
Average Sales Price: $403,512.00

That's a 6% decline in YOY average sales price!

Current number of Boston area homes on the market, courtesy of ZipRealty:
38,055
Number of listings that have been reduced at least once:
11,061
That's 29% (and doesn't account for homes relisted at new prices under different MLS #).


Enough with the trash talk, let the games begin!