I've been digging around, trying to understand how the inventory picture for SFHs and condos in MA will evolve in the coming years. It is not a data rich environment to say the least. However, here are the highlights of what I've been able to piece together:
Single Family Homes
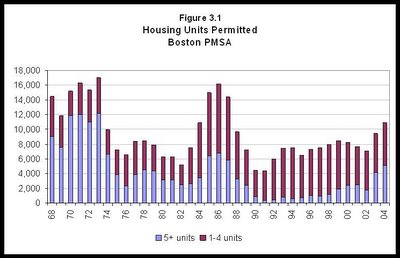
For a historical perspective on single family home permits over the past 20+ years, you can check out the MAR website here. They don't seem to have historical data on condos, perhaps because of the variable origins of condos (conversions vs. new construction). No signs that SFH permits are surging, but they haven't reported data for 2005 yet.
For some 2005 data, look at this article from the Boston Globe, 12/30/2005: "2005 housing starts, including condos, have reached their highest levels since the 1980s real estate boom. Global Insight, a Lexington economics and consulting firm, estimated there will be 16,220 housing starts in the Boston metropolitan area this year, second only to the 18,400 starts recorded in 1988. But the firm forecast a sharp decline next year, to about 11,900." One obvious question not addressed, why the expectations of a pullback? Keep in mind these numbers differ from the MAR numbers linked above because they include condos, and are limited to the Boston area.
The Massachusetts Home Builders Association (no date given) haven't see a big surge in SFH permits, but "the area in Massachusetts seeing the most growth was permits for buildings with five or more units – a total of 4424 such buildings were permitted, an increase of 82% over the previous year." Which leads us to...
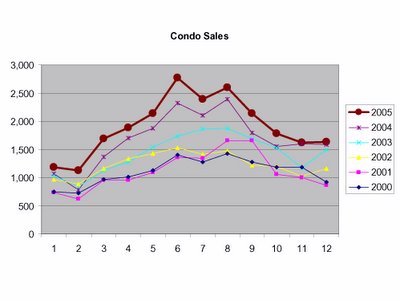
Condos and Multifamily Developments
The surging development of condo and multifamily rentals is undeniable:
From the Boston Globe, 11/17/2005: "Tom Meagher of Acton-based Northeast Apartment Advisors, which tracks rental housing, estimated that, with as many as 50,000 new apartments in the pipeline, the Boston area is poised to gain the largest amount of new multifamily housing since the late 1980s."
From the Boston Globe, 11/18/2005: "Nearly 14,000 residential units, primarily condominiums, are currently in the construction pipeline in Boston, the city's planning agency said yesterday. Though exact comparisons don't exist, officials believe the number of units under development equals or exceeds the building spree of the 1980s... Projects in the pipeline include those that have been approved by the BRA, have obtained city permits, or are under construction. Total residential units include rental apartments and condos, though the vast majority is condos."
"The BRA could not provide data on how many units were built during the late-1980s boom, though spokeswoman Meredith Baumann said longtime officials believe today's development exceeds the prior boom." "Kevin Ahearn, president of the Boston brokerage firm Otis & Ahearn, agreed. Based on BRA data, he estimated 4,930 condos are currently in the pipeline downtown, including the Back Bay and South End, and are slated for completion over five to eight years. That compared with about 3,300 condos in the pipeline in 1988 and 1989, he said."
From the Boston Globe on12/23/2005: "Marc Draisen -- executive director of the Metropolitan Area Planning Council... said the state has seen a recent acceleration of housing production, particularly in multifamily complexes. According to the state Office of Commonwealth Development, multifamily housing starts have doubled to about 7,000 a year."
From Northeast Real Estate Business, November 2005: "There are 8,700 age-restricted condominium units and 39,500 un-restricted condominium units in the development pipeline, from early-state design to sell-out phase. "
From US Dept. of Housing and Urban Development (pdf available): "Multifamily building activity increased (in MA), with permits issued for 15,232 units, an increase of 11 percent during the 12-month period ending September 2005. Massachusetts, and particularly the Boston-Cambridge-Quincy, Massachusetts-New Hampshire metropolitan area, supported the bulk of this new multifamily construction, with 9,549 units permitted. Reis, Inc., estimates that 2,831 apartment rental units will be added to the Boston market in 2005 and an additional 5,435 units will be added in 2006."
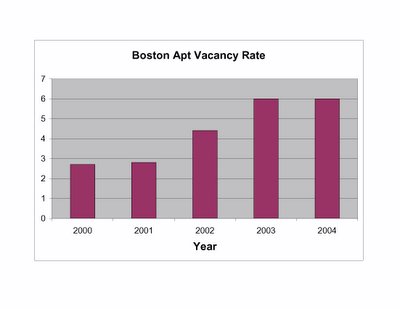
So is there pent up demand for all these new rental units? "According to Reis, Inc., the third quarter 2005 apartment rental vacancy rate for the Boston metropolitan area was 5.0 percent, unchanged from the third quarter of 2004. Reis, Inc., projects the completion of nearly 7,700 rental units by the end of 2006. In addition, if the condominium market slows further, unsold condominium units may be added to the rental inventory. This inventory increase could result in added vacancies and more competitive conditions if job creation remains sluggish."
Finally, for some fascinating insights into how the condo market has surged nationwide, with occasional mention of the Boston market, check out Condo Candor from PNC Real Estate Finance (August 2005). It's a terrific read, and lays out some of the speculation that has helped to fuel many markets around the country.
Conclusions
So what to make of all these numbers? The Boston Globe sums up the big quesion (11/18/2005): "With so much development in the works, an obvious question on the minds of realtors, bankers, and developers is whether Boston is repeating the 1980s housing boom and bust, when prices soared and then plunged after investors pulled out of the market."
Perhaps this question should be on the mind of everyone in the market - buyers, sellers, and especially speculators.
No matter what numbers you use, supply is clearly increasing. To really address this crucial question, we need to look at the other side of the picture - demand. I'll put together a post on this issue next.
-DT
P.S. If you're curious what some of these new condo developments look like, try CondoDomain.com or the list on the left border of John A Keith's blog to get a taste.
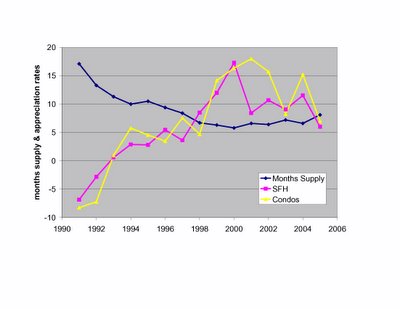 Looks in general like appreciation rates and inventory are inversely correlated. Makes sense - if supply excedes demand, prices should drop, and vice versa. How tight is the correlation? You can see it most easily by plotting appreciation rate as a function of inventory:
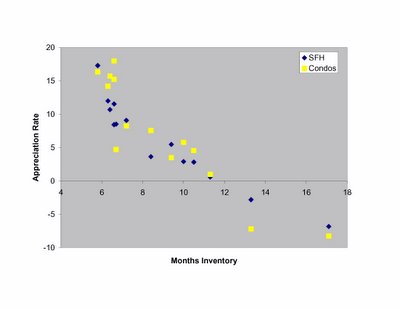 Pretty cool. So what does a 7.5-8.5 month inventory predict for appreciation: loooks like around 4-7%. Fair enough, I guess that is what MAR expects in a balanced market. One of the interesting things about the plot - it emphasizes how infrequently the market has been in "balance" over the past few years.
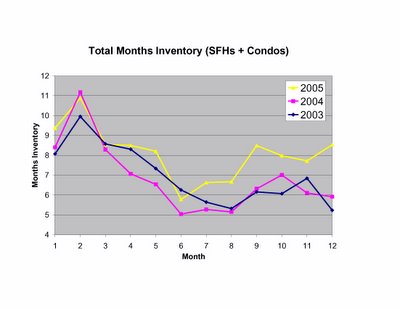 Even so, it may take some time for the continuing inventory build to put us in the predicted range for price declines (sustained 11+ months of inventory). Ofcourse, accelerating supply (here) and demographic trends (here) could speed up the process.
 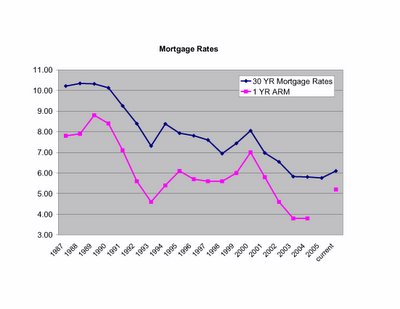 Mortgage rates over the last 14 years were generally (though not smoothly) trending downward. This provided a tailwind to price appreciation through increasing affordability. It's no stretch to argue that if mortgage rates increase appreciably (and they already have for ARMS), the entire relationship of appreciation versus inventory will shift leftward. In other words, the inventory levels associated with price declines will drop, and the tailwind of lowering rates will be replaced by the headwinds of rising rates.

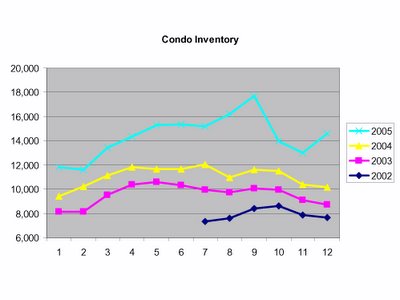
 In my opinion, here's the real news - check out the shocking surges in December inventories.
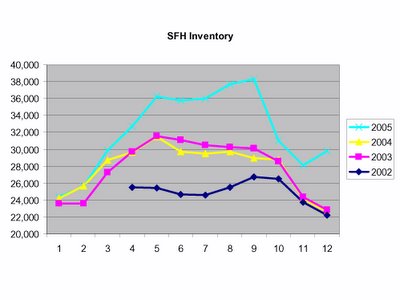
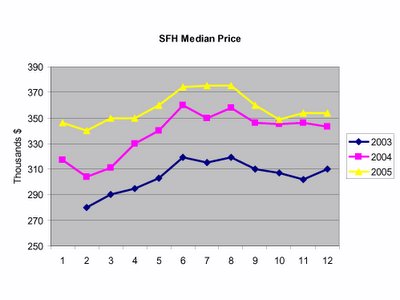
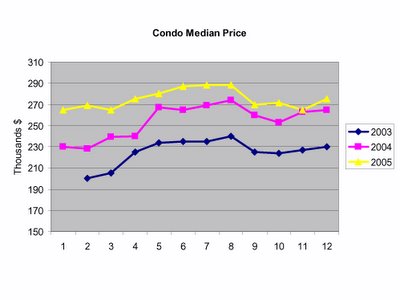
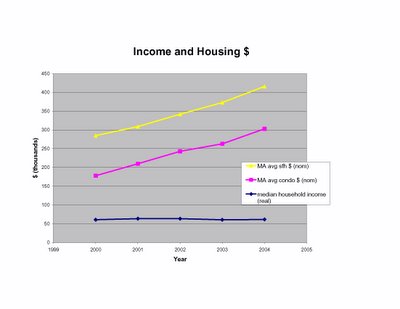 Real household incomes (adjusted for inflation) have been stagnant in MA for the past five years. The average home price has increased 46% and the average condo 70% over the same timespan. Yes, I've compared inflation adjusted income to non-inflation adjusted house prices, but one could easily argue that since house prices aren't included in inflation measures (rents are), then real income is the proper comparison.
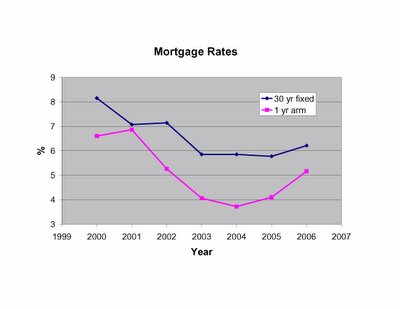 No question, low rates increased the purchasing power of those stagnant incomes. Couple this with the well-marketed message that only "monthly costs" are important, and suddenly people could afford to pay higher prices for an asset using "affordable" monthly payments.
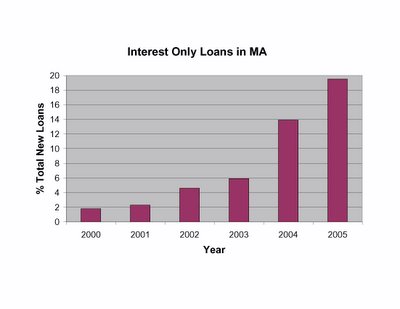 Keep in mind, with these loans
  In Boston the downturn has been even more striking, from 3.31 million residents in 2000-01 to 3.275 million in 2004, a loss of ~35,000 or >1% of the population. The most recent data, while more than a year old, suggest that the trend is accelerating.
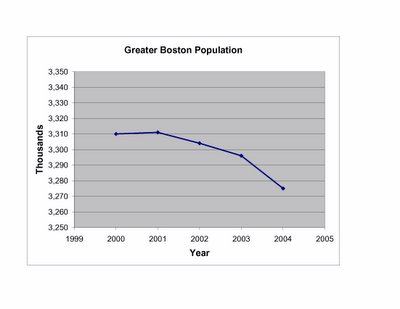


