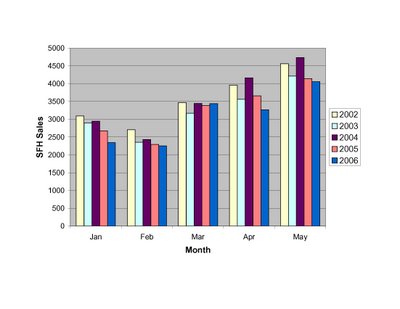
As requested by a reader, here are the monthly sales data for Jan-May as reported by the MAR. For comparison, the numbers are plotted relative to the past 4 years. As you can clearly see, monthly SFH sales have been gradually slowing for the past few years. So far this year only March 2006 escaped being weaker than each of the past 4 years.
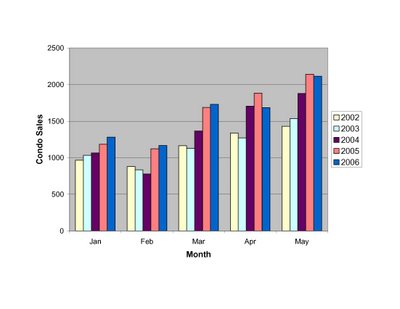
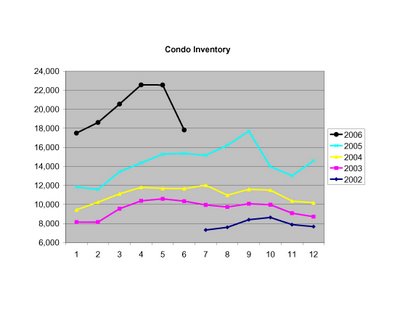
 In contrast, Condo sales have continued to set records until the past couple months. A momentary blip, or worrying trend?
To see how the modest flattening and/or slowing of sales compares with the the growing inventory of properties for sale, see the previous post
here. Clearly the number of properties entering the market has FAR exceeded the number of buyers during the last year plus, even though sales remain at or near recent peaks.
 Prices for both SFHs and Condos were DOWN ~1% compared to the same month last year. Sales were also off, 17% for SFHs and 14% for Condos:
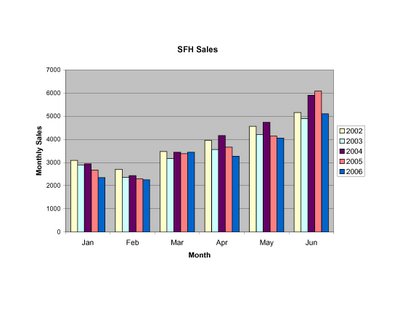
 Reported inventory numbers seem absurd:
 Any explanations? Houses flooded by the spring rains? Sellers giving up?
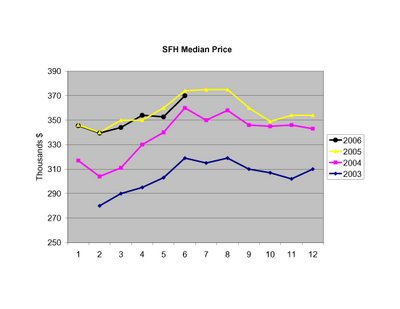
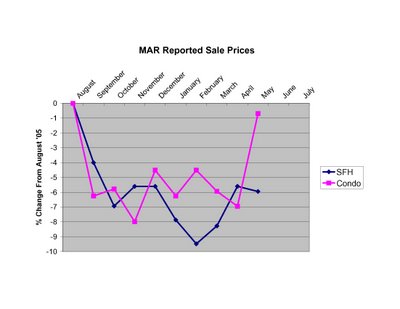 Clearly prices are down from the peak, even though condo prices made a strong move recently. But is this spring exhibiting typical strength? The short answer is NO. From the peak in '03 to May of '04, SFH prices went UP ~7% and condo prices went UP ~12%. From the peak of '04 to May of '05 SFH prices went UP ~1% and condo prices went UP ~2%. From last year's peak to this May, SFH prices are DOWN ~6% and condo prices are DOWN ~1%. Not huge, but clearly negative.
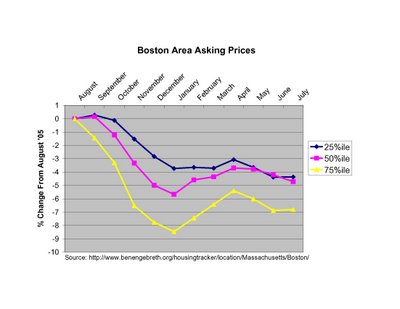 While the spring bounce in prices is apparent from the plot, asking prices peaked rather meekly in April well below last August levels, and asking prices have since returned to a downward trajectory. This is NOT a strong sign for prices for the remainder of the summer and the rest of the year.
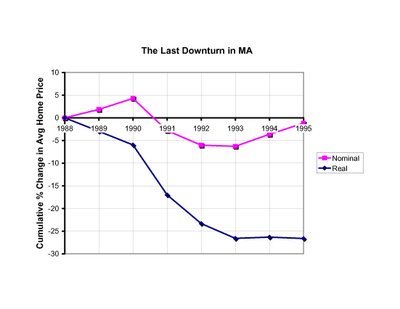 Note that while this previous market shakeout is regarded by many as a "housing bust", the biggest nominal decline in prices in a single year was only ~7% (from 1990 to 1991). Notice also that once the market started slowing the biggest declines took time (2-3 years) to develop, and the recovery was agonizingly slow. Food for thought when you hear talk of soft-landings and impending market rebounds.