Preliminary 3rd Q Analysis - Bear Market Deepens
With the September market stats now in hand we have the all raw data for the 3rd Quarter (July-August-Sept). The official numbers for Q3 won't be released by MAR for another few weeks, but I've estimated the year over year (YOY) results and come up with similar findings to those of the Warren Group (link). Notably, sales trends are weakening dramatically, and price declines are growing more pronounced. Not even a remote sign of a bottom in these data.

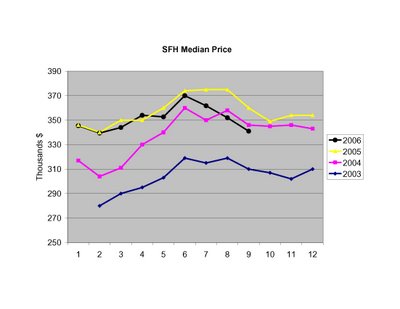
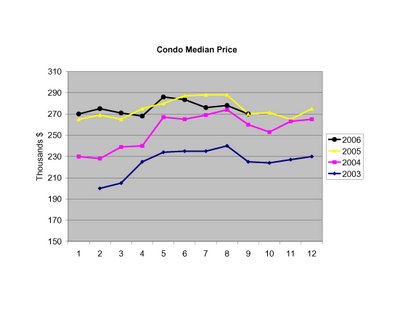 SFH prices for September are ~5% below 2005 levels, and ~1.5% below 2004 levels. The median price for sold condos was level with 2005.