Tuesday, January 31, 2006

Inventory as a predictor for price changes

The seemingly random assertion that 7.5-8.5 months inventory represents a "balanced" market in MA got me thinking - that figure must come from somewhere, right?

Let's take a look back at market history over the last 14 years. Plotted below are two sets of numbers: the annual "months inventory" as reported by the MAR, and the annual appreciation rates (avg prices) for SFHs and condos. The "months inventory" represents how many months it would take to clear all the inventory of homes on the market. (2005 data are my estimates based on monthly/quarterly MAR reports; official numbers will be released in Feb).

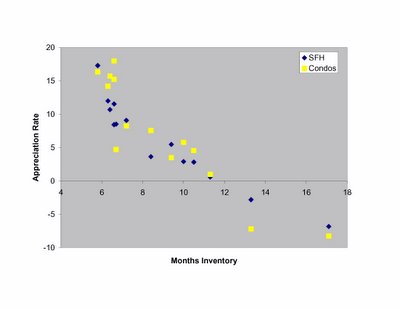
Looks in general like appreciation rates and inventory are inversely correlated. Makes sense - if supply excedes demand, prices should drop, and vice versa. How tight is the correlation? You can see it most easily by plotting appreciation rate as a function of inventory:

Pretty cool. So what does a 7.5-8.5 month inventory predict for appreciation: loooks like around 4-7%. Fair enough, I guess that is what MAR expects in a balanced market. One of the interesting things about the plot - it emphasizes how infrequently the market has been in "balance" over the past few years.

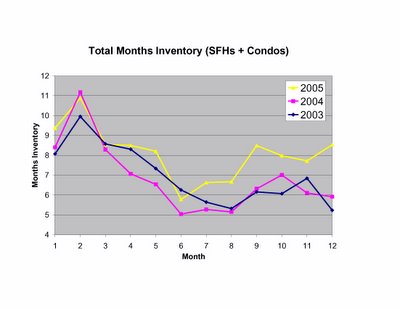
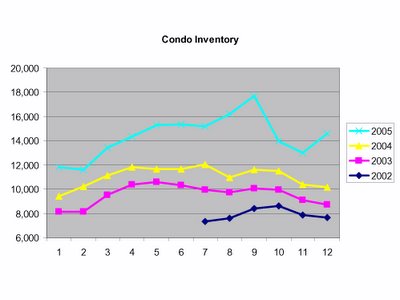
So what's been going on with inventory recently? Here are the monthly reports for inventory from the past 3 years (calculated from MAR data). Clearly there are seasonal patterns, but the divergence from established trends is crystal clear beginning around July. If December is any indication, the divergence appears to be accelerating.

Even so, it may take some time for the continuing inventory build to put us in the predicted range for price declines (sustained 11+ months of inventory). Ofcourse, accelerating supply (here) and demographic trends (here) could speed up the process.


What else might accelerate any change in the market? Interest rates appear to be the wildcard.

Mortgage rates over the last 14 years were generally (though not smoothly) trending downward. This provided a tailwind to price appreciation through increasing affordability. It's no stretch to argue that if mortgage rates increase appreciably (and they already have for ARMS), the entire relationship of appreciation versus inventory will shift leftward. In other words, the inventory levels associated with price declines will drop, and the tailwind of lowering rates will be replaced by the headwinds of rising rates.

Foreclosures: Tip of the Iceberg

The Boston Globe reports some startling statistics on MA foreclosures in "Housing Slowdown Squeezes Borrowers." Here's the telling graphic:


Keep in mind:

In 2005 appreciation rates were still positive.

As discussed earlier, resets for I/O and ARM loans will swell over the next few years.

And the Fed just raised rates another 0.25 point today, further increasing rates for adjustables.

Saturday, January 28, 2006

Prestige no protection from price drops

Inspired by Lowball! over at the Northern NJ Bubble and some reader suggestions, I put together a list of some recent sales that stand out for their price cuts. I don't have access to this info on a searchable database - I just went to Coldwell Banker, logged in, and searched MLS for recent sales in some prestigious Boston suburban towns. Plenty of homes are still selling for close to their list prices. But even in these desirable areas, sale prices are consistently below asking, and some much lower. I'm not able to access info on whether homes were relisted at lower prices before they sold, so the drops could be even more significant from original asking prices. Here are some recent standouts:

NEWTON , MA 02459
MLS# 70270545
Ask: $554,900
Sale: $450,000 (1/13/2006)
19% reduction

NEWTON , MA 02459
MLS# 70283827
Ask: $699,000
Sale: $625,000 (12/30/2005)
11% reduction

NEEDHAM , MA 02492
MLS# 70256995
Ask: $729,000
Sale: $655,000 (1/5/2006)
10% reduction

LEXINGTON , MA 02421
MLS# 70194581
Ask: $2,195,000
Sale: $1,730,000 (1/6/2006)
21% reduction

LEXINGTON , MA 02420
MLS# 70299424
Ask: $669,000
Sale: $600,000 (1/12/2006)
11.5% reduction

WELLESLEY , MA 02482
MLS# 70223416
Ask: $575,000
Sale: $450,000 (12/29/2005)
22% reduction

I'm not a big fan of anecdotal evidence, so I won't make too much out of this. But these numbers do emphasize that risk in this market is not restricted to less desirable neighborhoods. Most of these sellers no doubt made plenty when they sold, even at the reduced price. But if you moved in next to them last summer, they just set the new comps for your neighborhood.

Prices for New Homes Deflating?

Numbers out yesterday on sales of new homes. While the headlines focused on the surprise increase in sales (a volatile number with great statistical uncertainty), less attention was paid to the prices paid for new homes.

December 2004 Median Price: 229.6K
December 2005 Median Price: 221.8K
Percent Change: -3.3%

December 2004 Average Price: 284.3K
December 2005 Average Price: 272.9K
Percent Change: -4.0%

Those are YOY declines! Granted the decrease in prices reflects in part the sales weakness in the West (which has highest prices), but this is a stunning development, and one conveniently ignored by most interested parties.

A graphical summation of the trend from Calculated Risk:


Wednesday, January 25, 2006

Sixth Busiest December Ever!!!

MAR has the December market numbers (pdf) out for the Bay State.

December 2005 sales volume ranks as the sixth busiest December on record for single-family home sales in Massachusetts, an indication that the market is merely returning to a more normal sales pace after experiencing an accelerated pace for much of past three years.

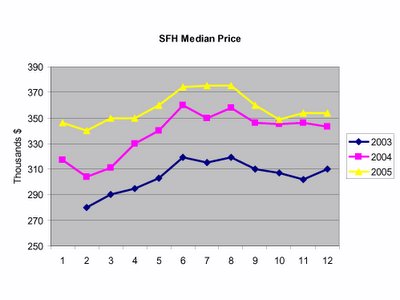
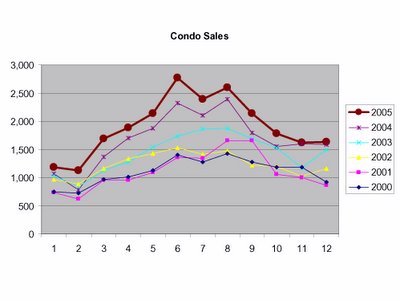
Prices are up marginally year over year, and condo sales continue to run stronger than SFH sales, at least relative to historical trends. The real news is a return to ballooning inventory (the telling data are plotted last).

Interestingly, the MAR seems perturbed about the bubble chatter:

False assertions of a price bubble in the local market also have prompted some buyers to delay their home buying decisions .

Their reassurance for those in doubt:

Despite concerns about an inventory glut, there’s a healthy balance between supply and demand at the present time.

Truth or fiction? They state that equilibrium in MA occurs at 7.5-8.5 months of housing inventory. OK, but in one year inventory has surged from 5.8 to 8.3 months for SFHs, and from 6.4 to 9 months for condos. Think inventory is going to magically stabilize now that we've reached a 'balanced' state?

Here are the numbers:

In my opinion, here's the real news - check out the shocking surges in December inventories.

Tuesday, January 24, 2006

Greenspan's Legacy

Excellent article by Nell Henderson at the Washington Post about Alan Greenspan and the US economy.

My favorite bits:

Under Greenspan's watch, the economy thrived despite stock market crashes, international financial crises, terrorist attacks, wars and other shocks. No wonder, as Greenspan prepares to retire next week, economists have lauded him as the greatest central banker ever.

Still, his legacy will be judged not just by his record at the Fed, but also by the economy he bequeaths. And when he leaves office Jan. 31, Greenspan leaves a nation awash in debt -- record household debt and a record trade gap.

...low interest rates worked like an intoxicant on consumers, who snapped up new cars and trucks with no-interest loans and seized on low mortgage rates to buy new homes and refinance old home loans. Household spending rose in 2001, 2002, and 2004, even as the wealth and income of the typical household fell or remained flat in the same period, according to an analysis by Moody's Economy.com... household debt rose faster in recent years than wealth or disposable income, reaching an unprecedented 126.1 percent of after-tax income in the third quarter, double its 1980 level.

When questioned on Capitol Hill in June about criticism that the Fed's strategy had helped inflate a housing bubble, Greenspan suggested that such imbalances were an acceptable price for avoiding another depression or a Japan-like economic stagnation. "We knew that in the process of what we were doing -- that is, addressing the consequence of a very severe deflation of a [stock] bubble -- carried with it potential side effects," Greenspan said. "As best we can judge, things have turned out reasonably as we had expected, both positively and negatively, but in our judgment, the positive effects of the policy far exceeded the negative ones."

So there you have it straight from the Maestro's mouth - the housing bubble is an acceptable price, and a predictable and necessary side effect of rescuing the economy from the last bubble.

Which leaves one to ask, what (or who) will rescue us from the curent bubble (or is it still just froth)?

Ghosts from another time...
As we near the time of Greenspan's exit, let me quote from John Kenneth Galbraith in "The Great Crash":

A bubble can be easily punctured. But to incise it with a needle so that is subsides gradually is a task of no small delicacy. Among those who sensed what was happening in early 1929, there was some hope but no confidence that the boom could be made to subside. The real choice was between an immediate and deliberately engineered collapse and a more serious disaster later on. Someone would certainly be blamed for the ultimate collapse when it came. There was no question whatever as to who would be blamed should the boom be deliberately deflated. The eventual disaster also had the inestimable advantage of allowing a few more days, weeks, or months of life.

When reflecting on the current state of affairs, definitely wait for the sands of time to flow before passing ultimate judgement on the success of our current Fed.

Don't Panic

When the National Association of Realtors says "Don't Panic, " what do you think?

In November, housing inventory – the number of homes available for sale – rose to its highest level since April 1986. Once again, the Chicken Littles came out of the henhouse shouting the “sky is falling”. They suggest that, with mortgage rates rising and demand slowing, a rise in inventory will inevitably cause home prices to crash.

Hmmm, a wee bit overly sensitive about the term crash?

Well, for those waiting for the crash, you can leave your protective headgear behind. Home prices are not going to crash. It’s simply not in the cards.

Why not? Check out the link. It's the same old stuff - money is still cheap, demand is still high, the economy is sound. All are true, but notice that all of these things are backward looking, and the current trends are all in the wrong direction. Best of all is this reason there won't be a crash:

Homeownership has proven itself as a viable investment alternative to stocks and bonds. Since 2000, there have been $4 trillion dollars in home equity gains. That is equivalent to $70,000 per household, an exceptional return on investment. For most homeowners, their home has an additional benefit – it provides shelter for them and their families.

There you have it - the NAR has so embraced the speculative mania of the housing market, they now view the fact that a house can provide shelter as a nice secondary benefit.

Still, shouldn't we be worried about all that inventory?

At the national level, we can see that home sales are slowing, the month-supply is rising, and as a result, balance is returning to the market. As a result, we do expect home prices to soften in the coming months. And slowing sales are good for the long-term health of the housing sector. So we should welcome a moderate slowdown, not panic from it.

But later on...

So, even though inventory may rise, home prices are not necessarily headed for a downturn. It is true that price appreciation may slow due to a softening of demand because of higher interest rates. But there will still be buyers out there. The good news is that there will be an available supply of homes for them to purchase.

So which is it? I guess with a press release like this, you can't get it all wrong.

Now for the local angle:
What markets had the biggest surge in inventories from the 3rd quarter 2004 to 3rd quarter 2005?

Chicago/Naperville/Joliet....132%
Binghamton, NY...............125%
Boston/Cambridge/Quincy......115%
Washington, DC................98%
Baltimore/Towson..............95%

Saturday, January 21, 2006

Affordability - Stretched to the Max?

The issue of "affordability" is complex. It combines elements of income, cash available as down payment, mortgage interest rates, creative mortgage practices, and ofcourse price.

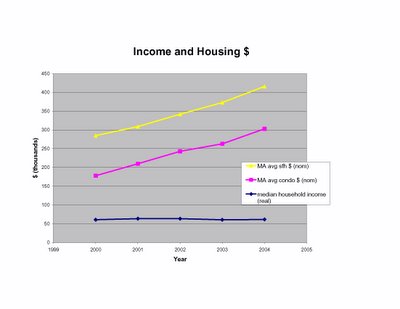
The simplest argument in support of rising prices: incomes are rising in tandem to support the prices. One look at the image below refutes this notion in MA.

Real household incomes (adjusted for inflation) have been stagnant in MA for the past five years. The average home price has increased 46% and the average condo 70% over the same timespan. Yes, I've compared inflation adjusted income to non-inflation adjusted house prices, but one could easily argue that since house prices aren't included in inflation measures (rents are), then real income is the proper comparison.

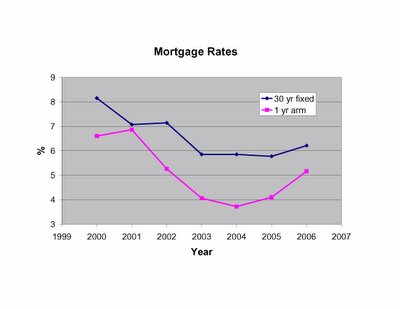
So how to account for people's ability to afford these prices? The cost of borrowing money reached multi-generational lows in the last 4 years. Here are the 30 yr fixed, and 1 yr ARM rates on January 1 of the past 7 years.
No question, low rates increased the purchasing power of those stagnant incomes. Couple this with the well-marketed message that only "monthly costs" are important, and suddenly people could afford to pay higher prices for an asset using "affordable" monthly payments.

Here's where things get worrisome. The escalating prices, and the psychology of "real estate never goes down," and "get in now or you'll be left behind" led inevitably to panic buying, bidding wars, and speculation.

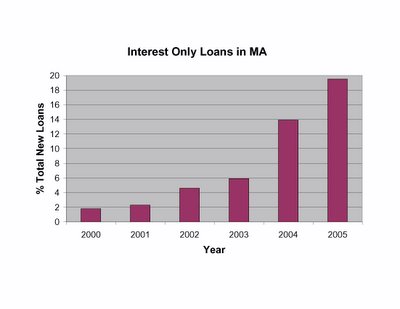
Nothing epitomizes speculation better than interest-only mortgages. (I know they can be a cash-flow tool for the financially savvy, but come on, how many IO loans are being used that way?) Take a look at the explosive growth in IO mortgages in MA as people have been stretching to purchase inflating assets.

Keep in mind, with these loans no principal is payed for a defined period. The principal is then payed down on an accelerated basis after the interest only period - leading to payment shock. The only equity accrued during the IO period is through price appreciation - and the only way to refinance these mortgages without spending a big pile of new $ is to have some equity. If you want to see some amazing home-financing horror stories, and get a sense of the crazy lending practices that got us to this point, check this blog out.

Even if you can refinance, the rise in short-term interest rates almost guarantees some amount of payment shock. What happens if you can't afford the new payments? Sell, or face foreclosure. If you don't have any equity, selling is a $ losing proposition. MA foreclosures rates have already begun to climb.

And I haven't even talked about the enormous value of adjustable rate mortgages in the US that will begin resetting in 2006 ($300 billion) and 2007 (a staggering $1 trillion), and are already creating problems for MA borrowers.

So have people really been able to afford the homes they have purchased over the past few years? Perhaps more importantly, will they continue to be able to afford their payments? The answer to these questions will likely have far-reaching consequences for the local, and even global economy.

Friday, January 13, 2006

Demographics, Demand, and Demise?

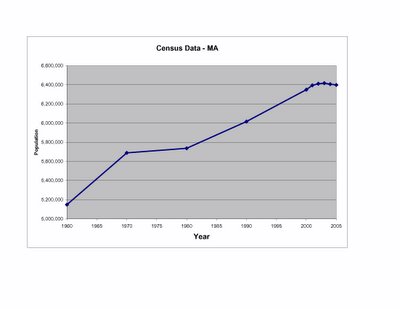
It was hard to miss the recent news that MA is losing population. But the recent demographic trends are perhaps weaker and more pervasive than most appreciate. For instance, population growth in MA has stagnated since the turn of the century, a trend last seen in the 1970s (US Census Data).
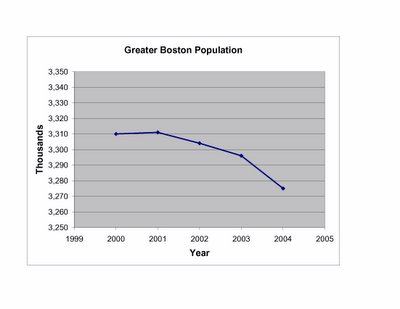
In Boston the downturn has been even more striking, from 3.31 million residents in 2000-01 to 3.275 million in 2004, a loss of ~35,000 or >1% of the population. The most recent data, while more than a year old, suggest that the trend is accelerating.

We know these demographic trends haven't resulted in weakness in home prices (at least not yet). But what about a housing market that exhibits a more direct response to changes in supply, demand, and affordability - the apartment rental market? From the CURP website, we can see a surge in apartment vacancies that mirrors the declining Boston population.


These vacancy rates are the highest since 1996. Incidentally, the peak in vacancies for the last 20 years was about 7% in 1991-92. Data from Northeast Apartment Advisors demonstrate that the improving supply to demand ratio has caused rents to decline modestly.


If you were a naive observer, having seen these data, would you ever guess that sale prices for homes and condos have been increasing in MA at a double digit pace for the past several years?

What does the future hold?

Predicting future changes in demand is a difficult business, mostly because a housing market is driven largely by psychology. Recently though, a demographic study has raised even more ominous questions about the demand equation in MA.

"Thirty-five percent of boomers said they want to leave the state for their retirement years. As a result, the state could lose 650,000 people -- about 10 percent of its population."

And who could have missed the fact that the first boomers are turning 60 this year. How many are planning on selling to help fund their retirement? How will their plans be shaped by the growing inventory of new and resale homes?

Monday, January 09, 2006

The Pipeline, Part II

The Center for Urban and Regional Policy (CURP) at Northeastern University has a series of presentations online here. They contain a wealth of information on the regional economy, housing, development and demographics.

The following plot contained in several of the presentations shows housing units permitted in the Boston PMSA over the last 36 years. The boom-bust cycle is apparent - as is the recent growth in multi-unit permitting.


In my last post, I quoted Global Insight from this Boston Globe article (12/30/2005) estimating that "there will be 16,220 housing starts in the Boston metropolitan area this year." Add that info to this graph and what previously looked like an orderly growth in permits now looks a lot more like past boom-bust cycles.

The CURP website also introduced me to this, from CHAPA, the Citizens' Housing and Planning Association:


A picture is worth a thousand words.

-DT

Saturday, January 07, 2006

The Pipeline

I've been digging around, trying to understand how the inventory picture for SFHs and condos in MA will evolve in the coming years. It is not a data rich environment to say the least. However, here are the highlights of what I've been able to piece together:

Single Family Homes
For a historical perspective on single family home permits over the past 20+ years, you can check out the MAR website here. They don't seem to have historical data on condos, perhaps because of the variable origins of condos (conversions vs. new construction). No signs that SFH permits are surging, but they haven't reported data for 2005 yet.

For some 2005 data, look at this article from the Boston Globe, 12/30/2005: "2005 housing starts, including condos, have reached their highest levels since the 1980s real estate boom. Global Insight, a Lexington economics and consulting firm, estimated there will be 16,220 housing starts in the Boston metropolitan area this year, second only to the 18,400 starts recorded in 1988. But the firm forecast a sharp decline next year, to about 11,900." One obvious question not addressed, why the expectations of a pullback? Keep in mind these numbers differ from the MAR numbers linked above because they include condos, and are limited to the Boston area.

The Massachusetts Home Builders Association (no date given) haven't see a big surge in SFH permits, but "the area in Massachusetts seeing the most growth was permits for buildings with five or more units – a total of 4424 such buildings were permitted, an increase of 82% over the previous year." Which leads us to...

Condos and Multifamily Developments
The surging development of condo and multifamily rentals is undeniable:

From the Boston Globe, 11/17/2005: "Tom Meagher of Acton-based Northeast Apartment Advisors, which tracks rental housing, estimated that, with as many as 50,000 new apartments in the pipeline, the Boston area is poised to gain the largest amount of new multifamily housing since the late 1980s."

From the Boston Globe, 11/18/2005: "Nearly 14,000 residential units, primarily condominiums, are currently in the construction pipeline in Boston, the city's planning agency said yesterday. Though exact comparisons don't exist, officials believe the number of units under development equals or exceeds the building spree of the 1980s... Projects in the pipeline include those that have been approved by the BRA, have obtained city permits, or are under construction. Total residential units include rental apartments and condos, though the vast majority is condos."

"The BRA could not provide data on how many units were built during the late-1980s boom, though spokeswoman Meredith Baumann said longtime officials believe today's development exceeds the prior boom." "Kevin Ahearn, president of the Boston brokerage firm Otis & Ahearn, agreed. Based on BRA data, he estimated 4,930 condos are currently in the pipeline downtown, including the Back Bay and South End, and are slated for completion over five to eight years. That compared with about 3,300 condos in the pipeline in 1988 and 1989, he said."

From the Boston Globe on12/23/2005: "Marc Draisen -- executive director of the Metropolitan Area Planning Council... said the state has seen a recent acceleration of housing production, particularly in multifamily complexes. According to the state Office of Commonwealth Development, multifamily housing starts have doubled to about 7,000 a year."

From Northeast Real Estate Business, November 2005: "There are 8,700 age-restricted condominium units and 39,500 un-restricted condominium units in the development pipeline, from early-state design to sell-out phase. "

From US Dept. of Housing and Urban Development (pdf available): "Multifamily building activity increased (in MA), with permits issued for 15,232 units, an increase of 11 percent during the 12-month period ending September 2005. Massachusetts, and particularly the Boston-Cambridge-Quincy, Massachusetts-New Hampshire metropolitan area, supported the bulk of this new multifamily construction, with 9,549 units permitted. Reis, Inc., estimates that 2,831 apartment rental units will be added to the Boston market in 2005 and an additional 5,435 units will be added in 2006."

So is there pent up demand for all these new rental units? "According to Reis, Inc., the third quarter 2005 apartment rental vacancy rate for the Boston metropolitan area was 5.0 percent, unchanged from the third quarter of 2004. Reis, Inc., projects the completion of nearly 7,700 rental units by the end of 2006. In addition, if the condominium market slows further, unsold condominium units may be added to the rental inventory. This inventory increase could result in added vacancies and more competitive conditions if job creation remains sluggish."

Finally, for some fascinating insights into how the condo market has surged nationwide, with occasional mention of the Boston market, check out Condo Candor from PNC Real Estate Finance (August 2005). It's a terrific read, and lays out some of the speculation that has helped to fuel many markets around the country.

Conclusions
So what to make of all these numbers? The Boston Globe sums up the big quesion (11/18/2005): "With so much development in the works, an obvious question on the minds of realtors, bankers, and developers is whether Boston is repeating the 1980s housing boom and bust, when prices soared and then plunged after investors pulled out of the market."

Perhaps this question should be on the mind of everyone in the market - buyers, sellers, and especially speculators.

No matter what numbers you use, supply is clearly increasing. To really address this crucial question, we need to look at the other side of the picture - demand. I'll put together a post on this issue next.

-DT

P.S. If you're curious what some of these new condo developments look like, try CondoDomain.com or the list on the left border of John A Keith's blog to get a taste.

Wednesday, January 04, 2006

Condo Sales and Inventory

Below I've posted the monthly sales and inventory levels for condos in Massachusetts (compiled from the Mass. Assoc. of Realtors) over the past 6 and 3.5 years, respectively. The increasing trend in sales is much more apparent than for SFHs, especially in 2003 and 2004. Sales increases continued in 2005, although the trend slowed.

As with SFHs, the condo inventory picture is telling. 2005 saw a profound increase in condo inventory levels, spiking in late summer. Since then condo inventory has dropped precipitously, plummeting nearly 5000 units over two months. Over those same two months, only ~3500 condos were sold. Where did all the condos go? And perhaps more importantly, will they be reappearing on the market in the coming weeks and months? Looking to the future, how many more condos are in the planning and construction stages throughout Boston and Massachusetts? I'll look around and see what I can find - tips and comments welcome.

-DT


Sunday, January 01, 2006

SFH Sales and Inventory

Below I've posted the monthly sales and inventory levels for single family homes in Massachusetts (compiled from the Mass. Assoc. of Realtors) over the past 6 and 3.5 years, respectively. Sales have been fairly consistent over the 6 year span, with inconsistent but gradual increases. The trend appears to be slowing in 2005, but also slowed in 2002.

What is more intriguing is the striking jump in inventory in 2005. It started in the spring, leading to big gains in inventory throughout the summer, followed by a late summer spike of truly unusual proportions. Then, as suddenly as this spike appeared, it dissipated. Speculative sellers seeing what the market would bear, or hidden inventory waiting to come back on the market this spring? Cleary, the scope of the ballooning inventory will determine the fate of the market over the coming months.