Tuesday, August 29, 2006

Sales and Inventory Trends

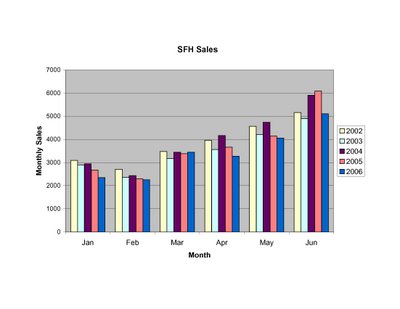
As detailed in the previous post, sales in MA in July were weak across the board. For comparison, here are the monthly sales figures (up to July) for the last 5 years:
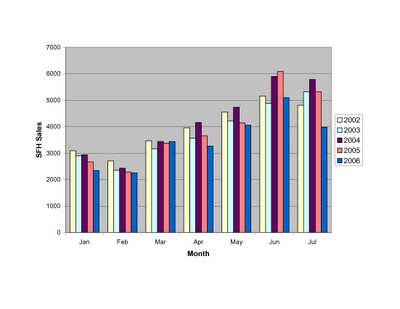
The slowdown in SFH sales appears to be accelerating this summer.


Monthly condo sales were at record levels as recently as the 1st Q of 2006, but this summer sales have slowed rapidly, retreating to ~2003 levels in July.

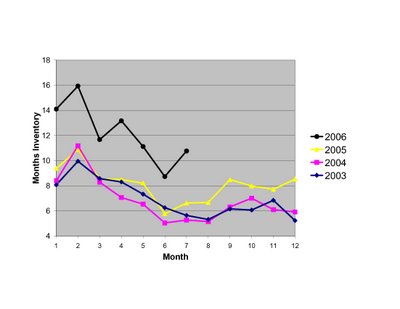
Months inventory for the market as a whole continues to paint a picture of weakness, although the surge in inventory from 2005 levels has slowed. The bigger problem now is with slowing sales.
Wednesday, August 23, 2006

July Market Wrap

This week saw the release of July market stats for Massachusetts.

First up, data from the Warren Group (reported here):
SFH sales: 5,070(down 27% YOY)
SFH median price: $339,000 (down 6.1% YOY)
Condo sales: 2,692 (down 23.5% YOY)
Condo median price: $277,000 (down 4.2% YOY)

Next up, data from the Massachusetts Association of Realtors (reported here):
SFH sales: 3,982 (down 25.3% YOY)
SFH median price: $361,750 (down 3.5% YOY)
Condo sales: 1,883 (down 21.4% YOY)
Condo median price: $276,000 (down 4.1% YOY)

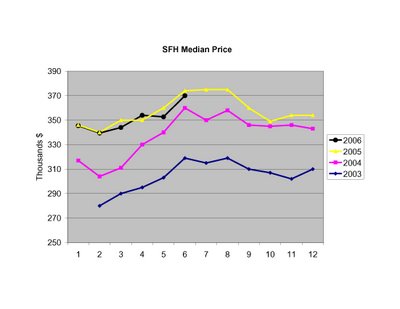
For those graphically inclined, here are the MAR price and inventory data relative to recent history. First up, SFH numbers:


(Note the inventory numbers reflect corrections for June by MAR).
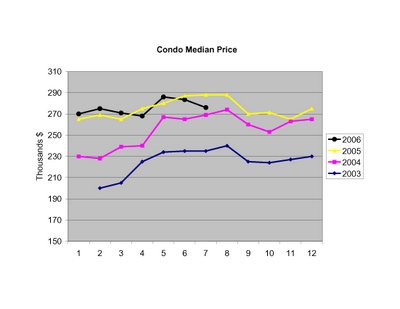
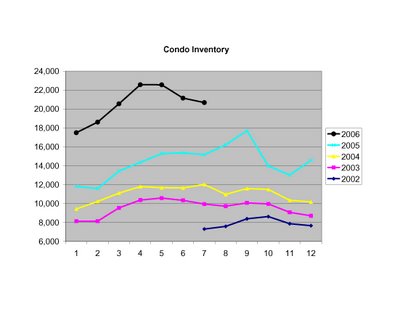
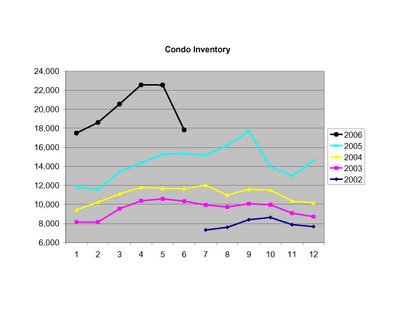
Here are the condo figures:


I'll post the sales graphs soon, along with the trend in months inventory. Needless to say, the numbers for July were unquestionably weak. The "soft-landing" scenario of moderate price growth seems to have suffered a rapid demise. The question of the day now is: how far down will prices go?

Sunday, August 20, 2006

2nd Quarter Weakness

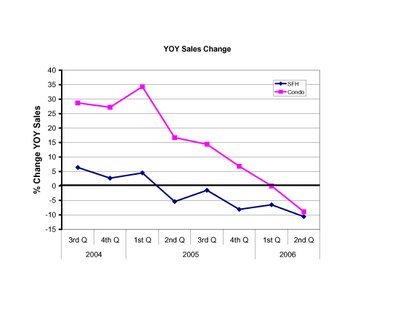
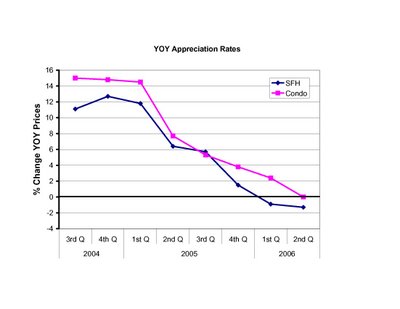
According to the Massachusetts Association of Realtors, statewide 2nd Quarter sales (April, May, June) of SFHs fell sales fell 10.6%, and condo sales fell 8.9% year over year. Median price declines were more modest, down 1.3% for SFHs and essentially flat for condos YOY. The Warren Group reported similar numbers, with SFH sales off 11.7%, condo sales off 10.9%, SFH prices off 2.9% and condo prices inching up 0.7% (details here). For a recent historical perspective, here are the MAR reported YOY % changes in median price and sales for the last 8 quarters.


The SFH sales market began to contract in the 2nd Quarter of 2005. This quarter the Condo market joined in the contraction.

Median prices for SFHs and Condos are now clearly at or below year ago levels.

Tuesday, July 25, 2006

June Market Wrap

June numbers were released today by the Massachusetts Association of Realtors (pdf here). First up, prices:

Prices for both SFHs and Condos were DOWN ~1% compared to the same month last year. Sales were also off, 17% for SFHs and 14% for Condos:

Reported inventory numbers seem absurd:


Any explanations? Houses flooded by the spring rains? Sellers giving up?
Sunday, July 23, 2006

Slow Burn

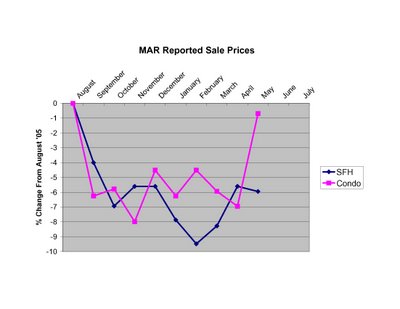
There seems to be some consternation among local market observers that price drops haven't yet proved to be "huge" (see example here from this weekend's Boston Globe). Let's try to put the current emerging downturn into perspective. Prices in MA typically plateau in the summer, decline somewhat in the fall/winter, then surge strongly in the spring. Here's a plot of what has happened to sales prices since last year's peak (August 2005) according to MAR. Clearly prices are down from the peak, even though condo prices made a strong move recently. But is this spring exhibiting typical strength? The short answer is NO. From the peak in '03 to May of '04, SFH prices went UP ~7% and condo prices went UP ~12%. From the peak of '04 to May of '05 SFH prices went UP ~1% and condo prices went UP ~2%. From last year's peak to this May, SFH prices are DOWN ~6% and condo prices are DOWN ~1%. Not huge, but clearly negative.
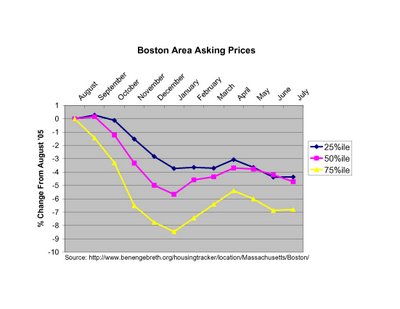
Given the fact that only 10% of homes on the market are selling in a typical month, we should also look at asking prices to get a more complete picture. It's been nearly a year since web tracking of asking prices and inventory for the Boston area have been available (see here). While this is only one segment of the MA market it is revealing to see the price declines broken down by quartiles. Clearly the highest priced properties (75th %ile) have suffered the most so far. Note: I averaged the readings for each month to provide a smooth trendline.
While the spring bounce in prices is apparent from the plot, asking prices peaked rather meekly in April well below last August levels, and asking prices have since returned to a downward trajectory. This is NOT a strong sign for prices for the remainder of the summer and the rest of the year.
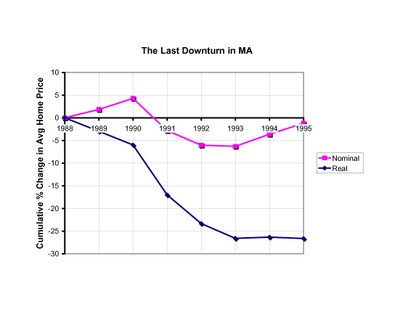
How does the current weakness compare to previous experience? Plotted below are the nominal and real (inflation adjusted) percent changes in average prices in MA from 1988 to 1995.
Note that while this previous market shakeout is regarded by many as a "housing bust", the biggest nominal decline in prices in a single year was only ~7% (from 1990 to 1991). Notice also that once the market started slowing the biggest declines took time (2-3 years) to develop, and the recovery was agonizingly slow. Food for thought when you hear talk of soft-landings and impending market rebounds.