Tuesday, April 25, 2006

March Market Wrap

Results for March were posted today by the Massachusetts Association of Realtors (link). Before going to the results, let me remind you that the March numbers represent sales typically originated in the preceding two months, in this case January and February. Given the mild winter of 2006 (especially January) and the brutal winter of 2005 (blizzard), I was expecting a nice bump in the numbers. Sales were up, but barely (about 2% yoy),, and prices were down for SFHs and up only slightly for condos.

Here are the median sales price data for March:


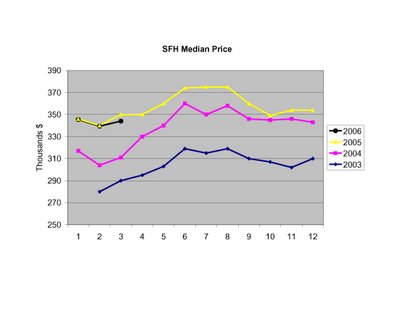
SFH prices were down 1.7% relative to last year. Cumulative 1st quarter prices are also down. These results clearly demonstrate falling SFH prices on a statewide level.

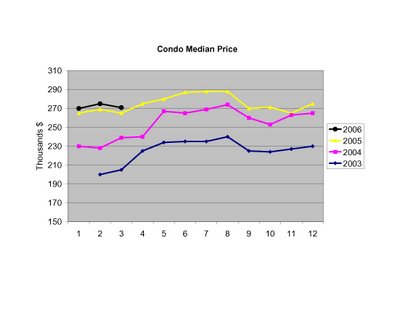
Condo median prices were up 2.2% relative to last year, and will be up about the same for the 1st quarter. (Up in nominal terms, but down in real terms) Last year in the 1st quarter condo prices were appreciating at ~14%, so the market deceleration is clear.

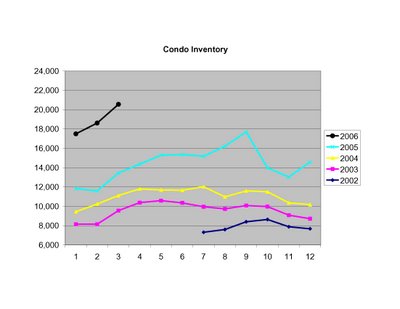
Inventory numbers continue to surge. According to MAR, inventory levels are the highest in more than a decade - and they show no sign of slowing.

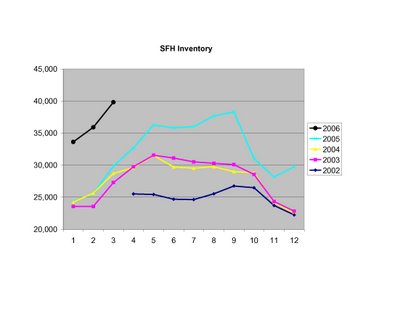
Notice I had to extend the y-axis range in both plots to accomodate the growing inventory of unsold homes.

Similar MA sales and price numbers were also released today by the Warren Group, as reported in the Boston Globe (here).

Monday, April 17, 2006

Metrics of market direction

The Wall Street Journal's Real Estate Journal recently addressed the metrics to evaluate when sizing up a market's near-term direction. Let's see how MA stacks up:

As a rule of thumb, assume that most home shoppers won't want to take on a mortgage that's more than three times their annual income.
Creative financing and record-low mortgage rates made this rule of thumb temporarily obsolete, but rising rates will bring it back into play. While I don't know the average mortgage to income ratios in MA, the current ratio of median SFH price (2005) to median (2004) income is ~6.5, for condos it is ~5 in MA.

Among the local factors you should check are inventory levels, which measure how long it takes for houses to sell, assuming no other houses were listed. (Equilibrium is between five and six months -- anything shorter indicates tight supply, which tends to lead to higher prices).
No need to add to recent posts covering the surge of inventory levels that continues unabated.

Also check out housing starts and permits -- rising numbers could mean that a market is becoming overbuilt, which can cause prices to drop.
This is not typically a problem in MA, but I've made the case (here and here) that even the relatively modest increases in new construction currently underway will glut the market as outmigration and demographic changes play out (see here).

Also, take a look at time on the market -- if this number is rising, it can be an early warning sign that a market is cooling.
Check out this recent Boston Herald article that points out the growing inventory and days on market in MA.

Of course, you'll want to find out if prices are being cut in your target neighborhood.
Statewide median prices have already peaked and look poised to turn down as the year progresses. According to ZIP Realty, of the 46,500 houses for sale in the greater Boston area, >33% (15,700 houses) have reduced list prices. For a closer look at individual homes, towns, and zip codes, including historical value plots, check out the wealth of info available at Zillow.com.