Affordability is THE problem
There's been talk recently about a potential bottom in the local and national real estate markets. After all, the economy is still growing, mortgage rates are low, what could keep our local market from re-igniting? In a word - affordability. Prices in MA rose much faster than incomes for the last 7 years. Sure mortgage rates are low, but can't we figure in the effect of mortgage lending rates to see if they compensate for the high prices? I've assembled three plots from a variety of sources that attempt to do just this.
First up is data from "The Greater Boston Housing Report Card 2005-2006" available as a PDF from CHAPA (PDF here). Lots of great information available in the report, but let's focus on their affordability analysis. Here is their description of how they estimate the number (and percentage) of communities affordable to existing residents and new buyers throughout Massachusetts in 2005:
A municipality’s housing is considered “affordable” for this analysis if the annual cost of supporting a mortgage, real estate taxes, and homeowners insurance does not exceed one-third of the annual median income of households in that community. CURP also estimated the affordability gap for those unable to come up with a 20 percent down payment. Considered a “first time homebuyer” analysis, the calculation is the same but both the homebuyer’s household income and the purchase price of the home are estimated to be just 80 percent of the median for the community and the down payment is assumed to be 10 percent.
Note this analysis does not tell you anything about how affordable each community is, just how many communities meet their threshold of affordability. But also note that their analysis takes into account the prevailing mortgage rates, local taxes, and insurance. Here are the historical figures from their analysis: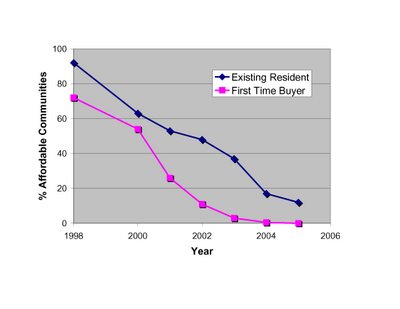 Clearly, we are reaching unsustainable lows when ZERO communities are affordable to "first time buyers," and ~10% are affordable to existing residents.
Next up is the National Association of Home Builders - Wells Fargo Housing Opportunity Index (available here). From their press release:
The NAHB/Wells Fargo HOI is a measure of the percentage of homes sold in a given area that are affordable to families earning that area’s median income during a specific quarter. Prices of new and existing homes sold are collected from actual court records by First American Real Estate Solutions, a marketing company. Mortgage financing conditions incorporate interest rates on fixed- and adjustable-rate loans reported by the Federal Housing Finance Board.

High readings on the HOI index means greater affordability. From the NAHB data, it doesn't look like now is an "opportune" time to try to purchase a house in the Boston area.
Last up is an analysis performed by Moody's Economy.com, and featured on the NY Times website as an interactive graphics tool (link here). Plotted below is the % of income local buyers had to pay for mortgage costs (no taxes or insurance) to buy a house in three MA Metro Divisions since 1979. Again, their analysis takes into account prices, incomes, and finance costs.
 The cost to service a mortgage in these areas is near or above the unsustainable levels reached at the last market top in the late 80's.
12 comments:
The ratio of incomes to prices is also two standard deviations above the mean. See:
http://www.bostonbubble.com/forums/viewtopic.php?t=141
I know that the Realtor groups like to use monthly payments instead of total price in their affordability analysis, probably because it makes affordability look a little less abysmal, but I prefer total price for several reasons. Primarily, looking at monthly payments ignores the size of the down payment, the type of loan, inflation, and holding time. See:
http://www.bostonbubble.com/forums/viewtopic.php?p=457#457
Hello.
I just posted that I would like to see similar trend data with
* income to sale price (i.e. excluding loan cost)
* per square foot (finished and unfinished, to account for growth in average house size)
I like your blog (yours too, Bostonbubble).
Inexpensive Home Building
FREE Q3:2006 reports for Orange County, Inland Empire, Ventura, DC & New York
They join prior FREE reports on Bakersfield, Boston, Chicago, Denver, Las Vegas, Los Angeles, Miami, San Diego, San Francisco and Seattle.
thebubblebuster.com
Nice post. The most compelling data is from Moody's, which indicates that the Boston-Quincy metro subdivision currently has a 30% mortgage to income ratio. (On the 30% number see Note 1 below).
According to the Moody's data, both the median and average mortgage to income ratio for the quarter-century of Boston data is 26%.
We are currently higher than the median ratio by about 4%, MUCH less than Southern California and other true bubble markets, where the ratios have doubled. In order for the Boston ratio to return to the median, home prices would have to drop 2-3% per year for 2 years, and incomes would have to rise at their historical rate of 3.5-4% per year; after that home prices could again rise with wages, at 3.5%-4% a year. It would take 3.5 years for prices to recover, but over 6 years a nice profit of 10%-15% could be realized. On the average home worth $400,000, that's $40,000-$60,000 of profit PLUS the tax benefits of home ownership, principal reduction, and the benefits of a fixed payment vs. inflationary rent.
But one could also argue that the mortgage to income ratio SHOULD be higher now than over the last 25 years because (a) since 1997, $250,000 in capital gains on a home is tax-free ($500,000 for a married couple), thus increasing the return on owning a home (and justifying investing more of one's income on it), and (b) more and more people use home offices as a secondary or exclusive place of work, such that an increasing portion of aggregate mortgage costs are really business expenses and written off as such, hence already netted out of net income.
Even without these critical considerations, the average over-valuation is small enough that smart buyers can still make excellent bets on up-and-coming neighborhoods (eg. along the existing and new T corridor through Somerville, or in up and coming areas of Cambridge) - where the 5-6 year appreciation rate can be substantial (and tax-free!) as prices "catch-up" to other core urban markets.
There are good deals to be had that capitalize on the secular demographic shift to urban areas. The best approach for a thoughtful buyer is to hunt for an asset in a fast-improving neighborhood and to bargain hard for it while the buyer's market last, not sit it out until the buyer's market is over.
Keep in mind, too, that Moody's - which compiled the data you cite - thinks that Boston's housing market bottomed out this quarter and will rise (barely) in 2007.
______________________________________
Note 1. You show a 31.7% ratio for 2005 and a 33.3% ratio for 2006, but you use Moody's 2005 "YTD" and "Current 2006" numbers, which are for the year through the fall and cannot be compared to the full-year numbers for 1979-2004. (Median prices are higher for a year through the fall than for the whole year). The 2006 number is in fact outdated, since interest rates were much higher in the fall and have since come back down to year-ago levels. Home prices are lower now than last year, and incomes are higher, so with roughly equal interest rates the mortgage to income ratio should be LOWER than last year. Here's my math: since incomes are up 8% or so since 2004, and home prices went up by that much in 2005 and have since retreated, let's say that the curent mortgage to income ratio is equal or less than the 2004 ratio of 30.6%. I've used 30%. As a point of comparison, Bubblebuster.com's 3Q report gives 30.7% as the mortgage+tax+insurance to income ratio - and that's the number BEFORE interest rates dropped in November.
Finally, it is worth keeping in mind that prices have probably dropped more than MAR/Warren Group stats reveal, since the median sold house is a nicer house than the median house that sold last year.
P.S. The CHAPA and NAHB data are less relevant than the Moody's data, which allow us to compare the current ratio with an historical median and average ratio of mortgage payment to income.
By contrast, CHAPA and NAHB/WF numbers apply an arbitrary cut-off as to what percentage of income should by used for housing costs.
Which brings me to a crucial distorting statistic: Boston has always had a huge percentage of renters, many with lower incomes. There is no indication that housing production costs will decline enough to provide housing that the 50% of the population that rents will ever afford.
On average, renters earn just a fraction of what home-owners earn. The fact that affordability is declining does not mean that home prices will decline. Homes could have been super-cheap at the beginning of the series. The question is, at what point does affordability for homeowners become so low (eg. the mortgage cost become so high relative to HOMEOWNERS' income) that home prices have to fall?
Which brings us back to the Moody's data and the comparison of current ratios of mortgage cost to income and median/average ratios of the same. That's the more useful statistic.
November numbers are in... single family prices down and condo prices slightly up.
The results are consistent with the theory that demand is robust for urban condos, and weak for suburban single family homes.
The price gain coincides with the reduction in interest rates in October, boosting purchasing power and - at least for condos - prices on November sales.
Completely contravening the affordability argument, the Warren Group statistics show Boston center-city condos selling for $625,000 in November 06, up from $585,000 in November 05.
Boston condo sales increased from 142 to 183.
All the following stats compare November 06 and November 05.
Brookline: condo prices increased from $449,000 to $458,000; condo sales increased from 43 to 49.
Dorchester sales increased from 47 to 80; prices decreased from $288,000 to $275,000 (but on a much larger, hence dissimilar sample of condos).
Cambridge: condo prices down from $442,000 to $430,000; condo sales down from 75 to 69.
Somerville: condo sales increased from 27 to 45; condo prices decreased from $353,000 to $295,000, but again on a much higher volume of sales (hence a dissimilar sample).
(Many Dorchester and Somerville sales are occuring in newly gentrifying, but cheaper neighborhoods that are still within the urban core market.)
These cities, comprising what I call the urban core market, are showing enormous strength in sales and price despite the slowing housing market.
Things must be awful in the suburbs - worse than the statewide averages.
The data confirms the importance of distinguishing the suburban single family from urban condo markets. The retirement of the baby boomers will only compound the secular shift in demand towards the latter product.
notsofastlouie-
I don't have access to Warren Report numbers - but those you quote here don't seem that strong to me. Do they provide any breakdown of price per square foot?
I find analyzing the condo market very, very challenging given the massive amount of renovation and luxury development that has gone on in the last few years. You seem to acknowledge the difficulty when you state "prices have probably dropped more than MAR/Warren Group stats reveal, since the median sold house is a nicer house than the median house that sold last year." Doesn't this apply in even greater magnitude to condos in the 'urban core market,' and doesn't that mean condo prices have actually dropped significantly?
It seems to me that there should be two analysis for affordability. One for someone whose existing home equity has risen proportionately with the market. Enabling them to, in par, keep pace with the rising market. Second would be those that are entering the market for teh first time and would be therefore more affected by increasing prices. Existing homeowners on teh hunt for a new home would only be priced out by the rate at which teh spread between what they are selling and what they are seeking has appreciated ?
dt: Thanks for the feedback.
1. When the state-wide median condo price was down a few percentage points over the summer (after rates spiked), I argued that condo prices were probably down more than the change in median condo price for the following reason. This summer, sales volume was lower than the previous year while inventory was rising, implying that buyers were selecting nicer units from the pool of available units. If that's true, then the median unit sold in the summer of 2006 was probably nicer than the median unit sold during the summer of 2005, when inventory was tight and buyers had much less choice.
Since the summer, inventory in the urban core market has been decreasing substantially, so I don't think that analysis applies anymore, at least not for the urban core market. In fact, in certain urban markets (Somerville and Dorchester) sales are way up as neighborhoods gentrify - the median sold condo unit is in a less desirable location (at least from the yuppie perspective).
2. I think one can in fact track the urban core market (principally a condo market) as a whole. Some of the smaller individual towns will show substantial variation month-to-month and season-to-season based on specific large developments; but the town statistics are still telling, and one can always aggregate sales from each of the individual markets.
For town-specific data go to the Warren Group website and access "Townstats," which is free upon registration. There is no price per foot data, but according to MAR units are 10-20% larger today than in the early 1990s. This is so largely because of more restrictive zoning requirements.
3. Renovations and luxury developments may skew the quality of the product on a year to year basis, but the median price goes some way toward correcting for outliers, if we're trying to compare apples to apples over a short period of time.
Over a multi-year period, the huge investment in renovation since rent control ended in 1997 actually helps explain the doubling in housing prices (along with lower rates). It shows that the price rise is not so much from speculation, but rather from the sudden doubling in rents (post rent-control) and the corresponding relative affortability of condo ownership vs. apartment renting (especially as rates fell after 2000).
All this compounded by the demographic shift away from families with children and toward yuppies.
dt:
I aggregated the November condo sales for what I call the 'urban core market,' which here includes Boston, Cambridge, Somerville, Brookline, Dorchester).
Condo sales for November 2006 in the urban core market were 426 versus 334 in November 2005, a 28% increase.
Weighting the median prices in each market for share of sales indicates that prices were essentially flat year over year, despite the substantial increase in sales. Overall demand, as measured by dollars spent on housing, was up dramatically in the urban core market, driven by sales volume.
Is the sales jump not impressive?
I have never been a big fan of the real estate market. Im more into stocks than real estate. But this is one time that I will make an exception to the general rule. Housing prices have declined so much in certain areas especially the southwest. I can't look upon buying a house or condo as unwise.
Their are some bargains in the market today.
Post a Comment