September Price and Inventory Stats
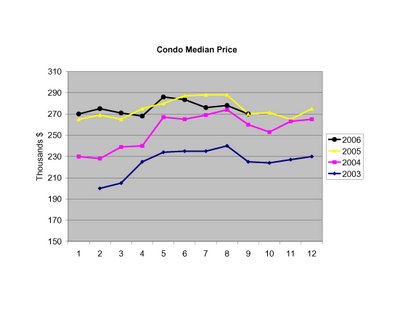
The MAR released September market stats today (link). Here are their reported median prices for SFHs and condos in relation to historical trends:
 SFH prices for September are ~5% below 2005 levels, and ~1.5% below 2004 levels. The median price for sold condos was level with 2005.
While there's been noise recently about the market "bottoming," including a front page report in the Boston Globe today (link), the inventory picture does not show any signs of a market bottom:

The plot shows "months inventory," which is the ratio between total unsold inventory (SFH and condos) and total sales for the last 3+ years. While inventory level dipped briefly below 9 months in June of this year, the surge back above 12 months shows continued weakness relative to historical inventory/sales levels.
More details to follow...
2 comments:
The decrease in transactions is undoubtedly significant. Sales have decreased substantially even in the urban core markets ever since interest rates rose in the spring.
But several points are worth noting:
1. The level of inventory in the urban core markets is not staggering. That indicates that sellers are either not moving or renting as they wait out the market. It's easier to rent in the city than in the suburbs...
2. Rental vacancy has declined significantly in the last year - it's now at 3.9%, suggesting a landlord's market. Expect rents to rise again in the next year.
3. Condos, which represent the vast majority of owner-occupied housing in the urban core market, have seen resilience in prices despite rising rates and wary buyers that are obviously renting and waiting.
4. A substantial number of net new jobs has been created in the last 24 months - some 33,000 in the last 12 months and some 20,000 in the 12 months before that. Job growth seems to be accelerating. Some of these job holders will eventually tire of renting.
5. New supply of condominiums is appallingly low, thanks to roadblocks to development all over the city. (Somerville residents just blocked a 200 unit project.) Many on this blog have cited NAA's Tom Meaghan, who reports that there are 100,000 units in potential development; but he also adds that this only translates to 5,000-9,000 completions per year. This level may not be adequate to absorb demand at the accelerated level of job creation of 3,000-4,000 per MONTH that we have seen more recently.
6. For all the talk of low affordability, the ratio of mortgage payments to price remains at 20-24%, in line with historical averages. (Household income to price, of course, is at an historical low: but that's because interest rates are low, a condition that may persist.)
To me, these factors suggest decent fundamentals going forward, at least enough to stabilize prices for a few years as wages rise and allow income to catch up to prices.
In thining about the relation of historical trends with the future market, it is worth recalling the first 6 months of 2001, during which period sales decreased dramatically as a result of the economic recession. Look what happened in 2002-2005. Smart buyers bought in 2001.
Great job as usual. These charts and graphs are supremely helpful.
It will be interesting to see how the next 9 months or so play out, as the September numbers reflect June & July sales which occurred before the media really took up the "bubble is bursting" rhetoric. Also the majority of ARM resets were happening in the second half of the year so these numbers do not reflect the sales & foreclosures that are surely coming, and there are even more resets happening next year.
It is going to be a bumpy ride and I have to disagree with notsofatslouie because I don't see the fundamentals of the market in terms of inventory & rent/purchase price improving at all in the next couple of months unless there is a severe drop in prices.
Post a Comment