Slow Burn
There seems to be some consternation among local market observers that price drops haven't yet proved to be "huge" (see example here from this weekend's Boston Globe). Let's try to put the current emerging downturn into perspective. Prices in MA typically plateau in the summer, decline somewhat in the fall/winter, then surge strongly in the spring. Here's a plot of what has happened to sales prices since last year's peak (August 2005) according to MAR. 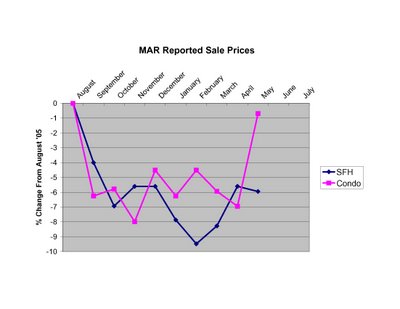 Clearly prices are down from the peak, even though condo prices made a strong move recently. But is this spring exhibiting typical strength? The short answer is NO. From the peak in '03 to May of '04, SFH prices went UP ~7% and condo prices went UP ~12%. From the peak of '04 to May of '05 SFH prices went UP ~1% and condo prices went UP ~2%. From last year's peak to this May, SFH prices are DOWN ~6% and condo prices are DOWN ~1%. Not huge, but clearly negative.
Given the fact that only 10% of homes on the market are selling in a typical month, we should also look at asking prices to get a more complete picture. It's been nearly a year since web tracking of asking prices and inventory for the Boston area have been available (see here). While this is only one segment of the MA market it is revealing to see the price declines broken down by quartiles. Clearly the highest priced properties (75th %ile) have suffered the most so far. Note: I averaged the readings for each month to provide a smooth trendline.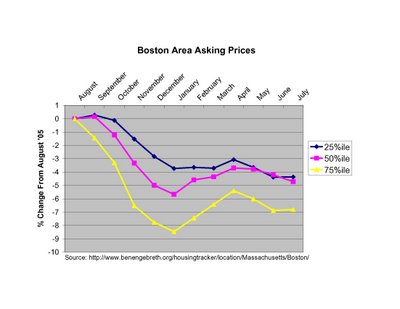 While the spring bounce in prices is apparent from the plot, asking prices peaked rather meekly in April well below last August levels, and asking prices have since returned to a downward trajectory. This is NOT a strong sign for prices for the remainder of the summer and the rest of the year.
How does the current weakness compare to previous experience? Plotted below are the nominal and real (inflation adjusted) percent changes in average prices in MA from 1988 to 1995.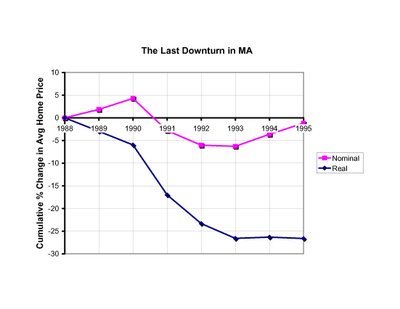 Note that while this previous market shakeout is regarded by many as a "housing bust", the biggest nominal decline in prices in a single year was only ~7% (from 1990 to 1991). Notice also that once the market started slowing the biggest declines took time (2-3 years) to develop, and the recovery was agonizingly slow. Food for thought when you hear talk of soft-landings and impending market rebounds.
2 comments:
Nice post. What is the source of your data on the 1988-1995 period?
Thanks to both of you for the feedback. Realestatecafe, I love the bubblemaps and the interactive effort to document hard hit areas of the market for buyers.
Notsofastlouie - the 1988-1995 numbers are calculated from Massachusetts Association of Realtors data (available at http://www.marealtor.com/content/trends.asp). The data series I used (Annual Sales and Prices for All Residential Property (1968-2005))combines average selling price for SFH and Condos, not a perfect metric, but a number that captures the essential historical trend. The correction for inflation uses historical CPI data from the U.S. Dept. of Labor, Bureau of Labor Statistics.
Post a Comment