April Market Wrap
April numbers came out this week from both the Warren Group (covered here in the Globe and here in the Herald) and the MAR (here). Given the historical numbers available from MAR, I'll continue to post updates based on their market stats.
The biggest surprise was the drop in sales from both last year and, shockingly, from last month. Typically sales rise throughout the spring, but that pattern was disrupted this year. SFH sales dropped 10% from last year and 5% from last month. Condo sales dropped 10% from last year and 3% from last month. The drop in condo sales is especially unexpected, given the strength in condo sales until now.
SFH prices recovered somewhat, and were basically flat from last year (up 0.3%).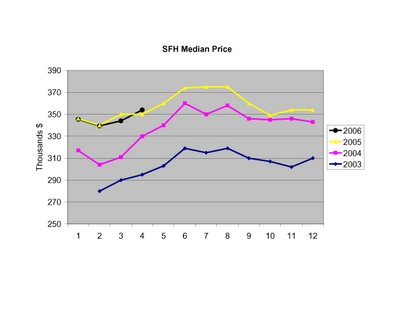
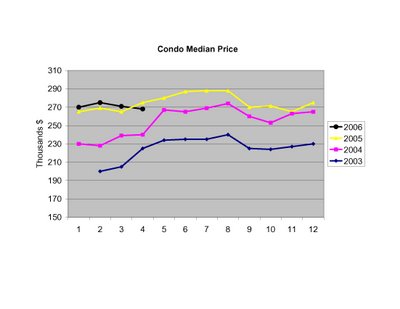
Condo prices took it on the chin, and were down 2.5% compared to last year. The first drop in 88 months. The condo price chart is suddenly exhbiting an ominous trend.
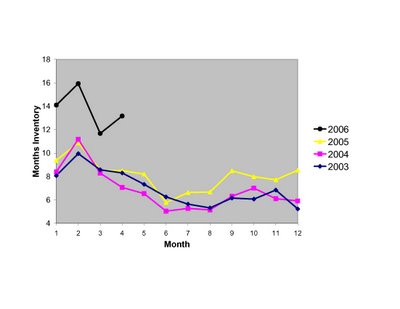
 The unsold inventory of SFHs continues to surge...
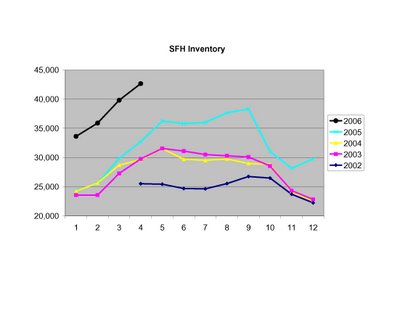
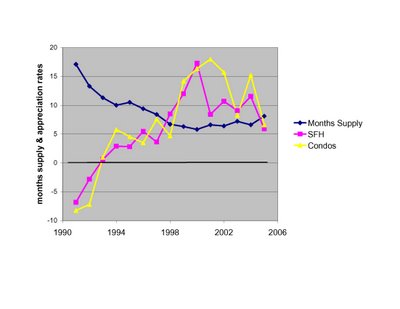
Below I've plotted the Months Inventory of combined SFHs and Condos to give a unified picture of the market's current state. Keep in mind MAR puts a balanced market at ~7.5-8.5 months inventory.
2 comments:
Here's what I think it means:
1. Real estate cycles are long. We saw decreasing inventory levels for a decade 1991-2000, followed by a broad trough 2000-04, and now inventory levels are rising dramatically. These sorts of market shifts don't reverse on a short time scale.
2. In general, changes in housing prices inversely track inventory: when supply is tight (low inventory) prices rise, when inventory is high, prices flatten or drop. Now that supply is surging, we are at inventory levels (~12-13 months) that in the past have meant lower prices. So far I think that is just beginning to show up in the monthly and quarterly numbers.
indigo-
1. My next post will estimate 2006 inventory based on the data so far this year. I did this a couple months back, and will update with the latest numbers.
2. MAR doesn't post data from before 1990, so I'll have to look elsewhere. Problem is, I can find historical prices (OFHEO) but not statewide inventories of properties for sale.
Post a Comment