Inventory up + sales down = ?
A few months back I showed how the inventory of homes for sale relates to changes in median sale prices (orginal post here). I'd like to update that post with the most recent market numbers, and talk about how current trends may shape this dynamic relationship.
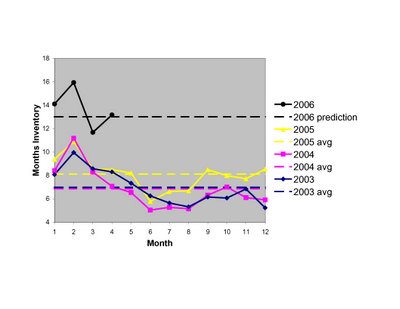
Below is a plot of the months inventory recorded in each month of the past 3+ years. I calculated this number by adding up the number of SFH and Condos on the market, and divided by the number of sales recorded that month by MAR. As you can see, there is a seasonal pattern to the numbers, with months inventory dropping to its lowest levels during the summer peak buying season. What is also clear is the decisive break that began last fall and continued into 2006. I've also included the average months inventory for each year (dashed lines), and a guesstimate I made back in February of what I think the 2006 average may look like based on past years behaviors.
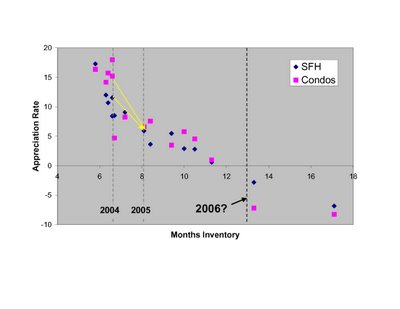
 Now going back further in time and using the average months inventory for each of the past 15 years, I've plotted the appreciation rates for SFHs (blue) and Condos (pick) as a function of the average inventory for each year. There is a clear inverse relationship between inventory and appreciation rates. To emphasize the shift in the market, I've included dashed lines showing the inventory levels for 2004, 2005, and the guesstimate for 2006. The yellow lines connect the 2004 and 2005 data points, showing the downward trajecory that began last year.
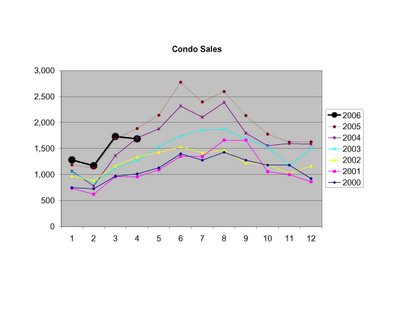
 As some have commented, even as inventories have ballooned over the past year sales have remained historically robust in MA, especially for condos. To some this is a sign of a strong but more balanced market. To others this is an ominous trend, as any slip in sales could further shift the market balance, which is already adding inventory at a steep rate.
Last month may signal the beginning of the next phase of the market, as sales weakened in the heart of the spring selling season. Plotted here are the sales in each month for the past 6+ years, both for SFHs and Condos.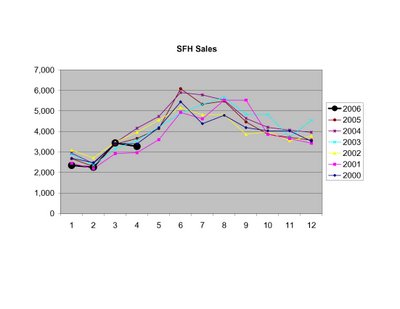
 Clearly the future is not something we can predict with 100% accuracy. But the data I've presented here, in the context of historical market behavior, indicate to me a high likelihood that prices will continue to drop. The RE market is incredibly complex and has a number of interrelated moving parts (population changes, income changes, mortgage rates, 2nd home and investor activity, rental prices, new construction, etc) but sometimes the message from supply and demand is all you need to know. This, I believe, is one of those times.
2 comments:
From the Boston Herald, summarizing the recent report from Harvard’s Joint Center for Housing Studies:
“The problem of affordability is not just a low-income problem any more. Middle-income families are facing affordability problems as well,” said Nicolas Retsinas of Harvard’s Joint Center for Housing Studies, which prepared the report.
Researchers attribute much of the problem to zoning laws that have limited house construction.
For instance, the study found Greater Boston municipalities issued just 7,974 building permits for new houses last year - a 16.6 percent drop from 1994.
The good news: Retsinas said a lack of excess construction means prices in Boston’s jittery housing market aren’t likely to collapse.
The expert said researchers found sharp price drops usually require a combination of overbuilding and big job losses.
The Harvard Joint Center for Housing Studies' 2006 annual report concludes that historically it takes both an economic downturn and overbuilding to trigger a significant correction in housing prices, and that neither condition holds today. If history is any guide, high inventory relative to demand (eg. a buyer's market) is not enough to lead to the freefall in prices many have predicted. The full report is at:
http://www.jchs.harvard.edu/
Post a Comment