Inventory as a predictor for price changes
The seemingly random assertion that 7.5-8.5 months inventory represents a "balanced" market in MA got me thinking - that figure must come from somewhere, right?
Let's take a look back at market history over the last 14 years. Plotted below are two sets of numbers: the annual "months inventory" as reported by the MAR, and the annual appreciation rates (avg prices) for SFHs and condos. The "months inventory" represents how many months it would take to clear all the inventory of homes on the market. (2005 data are my estimates based on monthly/quarterly MAR reports; official numbers will be released in Feb).
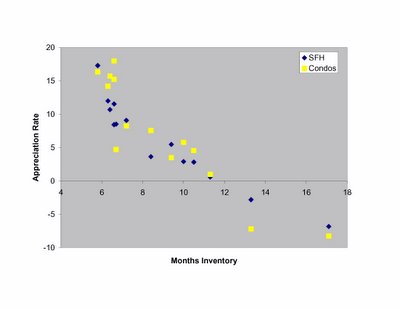
 Looks in general like appreciation rates and inventory are inversely correlated. Makes sense - if supply excedes demand, prices should drop, and vice versa. How tight is the correlation? You can see it most easily by plotting appreciation rate as a function of inventory:
 Pretty cool. So what does a 7.5-8.5 month inventory predict for appreciation: loooks like around 4-7%. Fair enough, I guess that is what MAR expects in a balanced market. One of the interesting things about the plot - it emphasizes how infrequently the market has been in "balance" over the past few years.
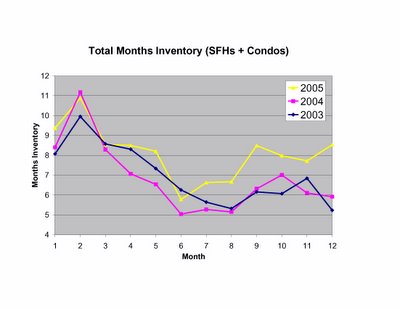
So what's been going on with inventory recently? Here are the monthly reports for inventory from the past 3 years (calculated from MAR data). Clearly there are seasonal patterns, but the divergence from established trends is crystal clear beginning around July. If December is any indication, the divergence appears to be accelerating.
 Even so, it may take some time for the continuing inventory build to put us in the predicted range for price declines (sustained 11+ months of inventory). Ofcourse, accelerating supply (here) and demographic trends (here) could speed up the process.
What else might accelerate any change in the market? Interest rates appear to be the wildcard.
 Mortgage rates over the last 14 years were generally (though not smoothly) trending downward. This provided a tailwind to price appreciation through increasing affordability. It's no stretch to argue that if mortgage rates increase appreciably (and they already have for ARMS), the entire relationship of appreciation versus inventory will shift leftward. In other words, the inventory levels associated with price declines will drop, and the tailwind of lowering rates will be replaced by the headwinds of rising rates.
No comments:
Post a Comment