There's been talk recently about a potential bottom in the local and national real estate markets. After all, the economy is still growing, mortgage rates are low, what could keep our local market from re-igniting? In a word - affordability. Prices in MA rose much faster than incomes for the last 7 years. Sure mortgage rates are low, but can't we figure in the effect of mortgage lending rates to see if they compensate for the high prices? I've assembled three plots from a variety of sources that attempt to do just this.
First up is data from "The Greater Boston Housing Report Card 2005-2006" available as a PDF from CHAPA (PDF here). Lots of great information available in the report, but let's focus on their affordability analysis. Here is their description of how they estimate the number (and percentage) of communities affordable to existing residents and new buyers throughout Massachusetts in 2005:
A municipality’s housing is considered “affordable” for this analysis if the annual cost of supporting a mortgage, real estate taxes, and homeowners insurance does not exceed one-third of the annual median income of households in that community. CURP also estimated the affordability gap for those unable to come up with a 20 percent down payment. Considered a “first time homebuyer” analysis, the calculation is the same but both the homebuyer’s household income and the purchase price of the home are estimated to be just 80 percent of the median for the community and the down payment is assumed to be 10 percent.
Note this analysis does not tell you anything about how affordable each community is, just how many communities meet their threshold of affordability. But also note that their analysis takes into account the prevailing mortgage rates, local taxes, and insurance. Here are the historical figures from their analysis:
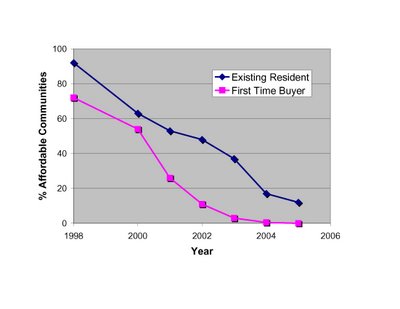 Clearly, we are reaching unsustainable lows when ZERO communities are affordable to "first time buyers," and ~10% are affordable to existing residents.
Next up is the National Association of Home Builders - Wells Fargo Housing Opportunity Index (available here). From their press release:
The NAHB/Wells Fargo HOI is a measure of the percentage of homes sold in a given area that are affordable to families earning that area’s median income during a specific quarter. Prices of new and existing homes sold are collected from actual court records by First American Real Estate Solutions, a marketing company. Mortgage financing conditions incorporate interest rates on fixed- and adjustable-rate loans reported by the Federal Housing Finance Board.
This analysis is similar to the CHAPA analysis above, except that it focuses more narrowly on the Boston area, looks at % of affordable homes (rather than communities), has data going back to 1991, and also somehow incorporates both fixed- and adjustable-mortgages into their "opportunity index."

High readings on the HOI index means greater affordability. From the NAHB data, it doesn't look like now is an "opportune" time to try to purchase a house in the Boston area.
Last up is an analysis performed by Moody's Economy.com, and featured on the NY Times website as an interactive graphics tool (link here). Plotted below is the % of income local buyers had to pay for mortgage costs (no taxes or insurance) to buy a house in three MA Metro Divisions since 1979. Again, their analysis takes into account prices, incomes, and finance costs.

The cost to service a mortgage in these areas is near or above the unsustainable levels reached at the last market top in the late 80's.
The fuel to make prices go higher is income available to support higher prices. According to all three analyses, this fuel is in short supply. That doesn't mean by itself that prices have to come down (although I think they will given the fundamental imbalance between supply and demand). But given that we are only slightly above historical lows in mortgage rates, there is very little room for inflation-adjusted prices to grow. Claims that "now is a good time to buy before prices rise" are ill-founded. There is not sufficient income to support higher prices.


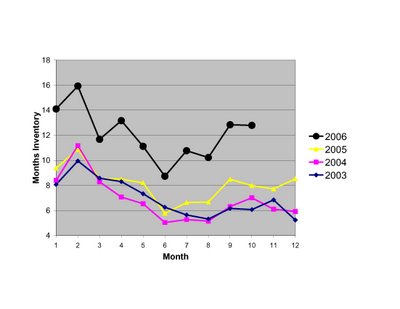
 Typically, the most informative single metric is "months supply," which indicates how long it would take to sell all inventory on the market at the current sales pace.
 More analysis to follow shortly.

 Clearly, we are reaching unsustainable lows when ZERO communities are affordable to "first time buyers," and ~10% are affordable to existing residents.
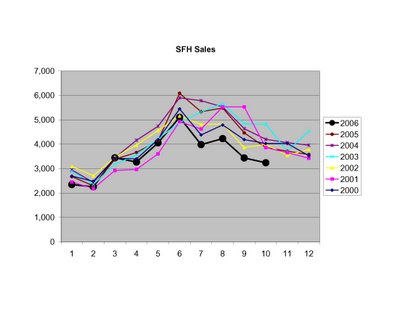
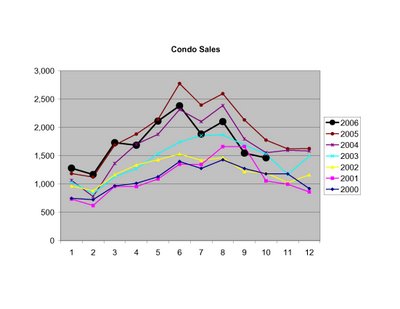

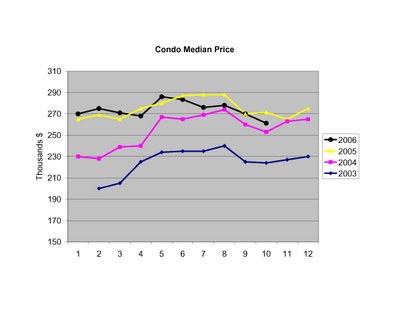 To put the current unsold inventory into perspective, here are the historical numbers according to MAR:
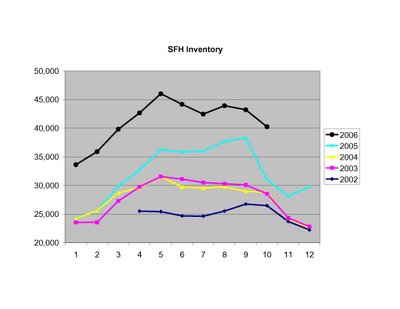
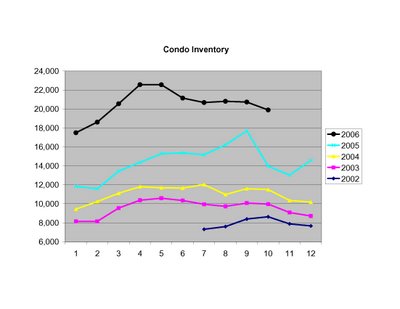 Finally, here is a look at months inventory (total SFH and condo inventory/total sales):


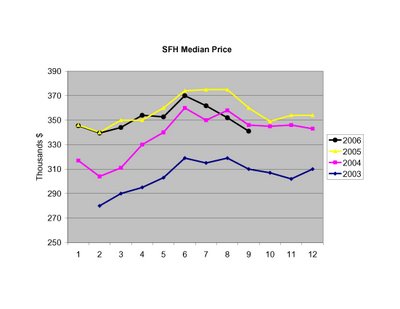
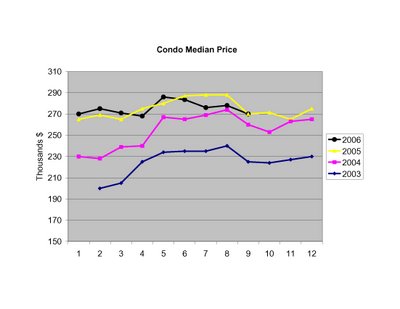 SFH prices for September are ~5% below 2005 levels, and ~1.5% below 2004 levels. The median price for sold condos was level with 2005.
