Homeowners or Homedebtors?
The real estate industrial complex and our elected leaders continue to extoll the virtues of homeownership. Certainly it's a laudable goal to own one's home. But while headlines trumpet homeownership rates (the percentage of households that pay a mortgage or own outright, rather than rent), they do not typically address how much of our home's we actually own. The following chart (from Barron's Econoday courtesy of The Big Picture: Real Estate , 4/17/2005) shows that Owners Equity (as a percent of home value) has declined markedly over the past 25 years.
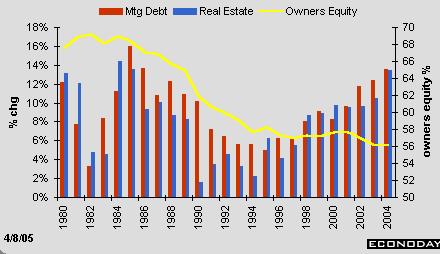
Notice that even over the last few years during a time of strongly increasing home prices, owner equity has continued to decline. How? The housing ATM has induced the continued growth of mortgage debt (the red bars) at a faster rate than real estate values have grown (blue bars).
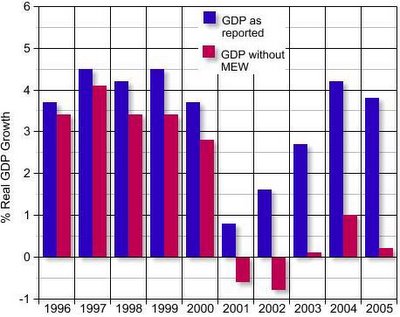
This borrowing has been a major contributor to GDP over the past few years. Calculated Risk has used the Goldman Sachs estimate that ~2/3 of mortgage equity extracted ends up fueling consumption to calculate US GDP over the past 10 years with and without the housing ATM.
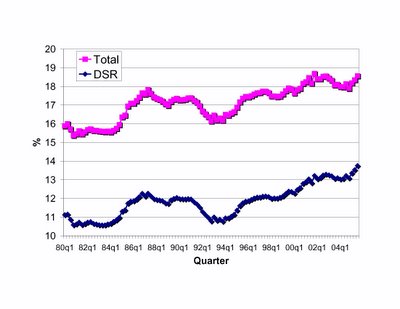
While the continued binge of borrowing has fueled consumption and GDP growth, it has created unprecendented indebtedness in US consumers. The Federal Reserve tracks several metrics of debt. Among these is the Debt Service Ratio (DSR), which is an estimate of the ratio of debt payments to disposable personal income. Debt payments consist of the estimated required payments on outstanding mortgage and consumer debt. The financial obligations ratio (denoted Total in the plot below) adds automobile lease payments, rental payments on tenant-occupied property, homeowners' insurance, and property tax payments to the debt service ratio. Both data series plotted quarterly over the past 25 years tell the story of escalating consumer debt.